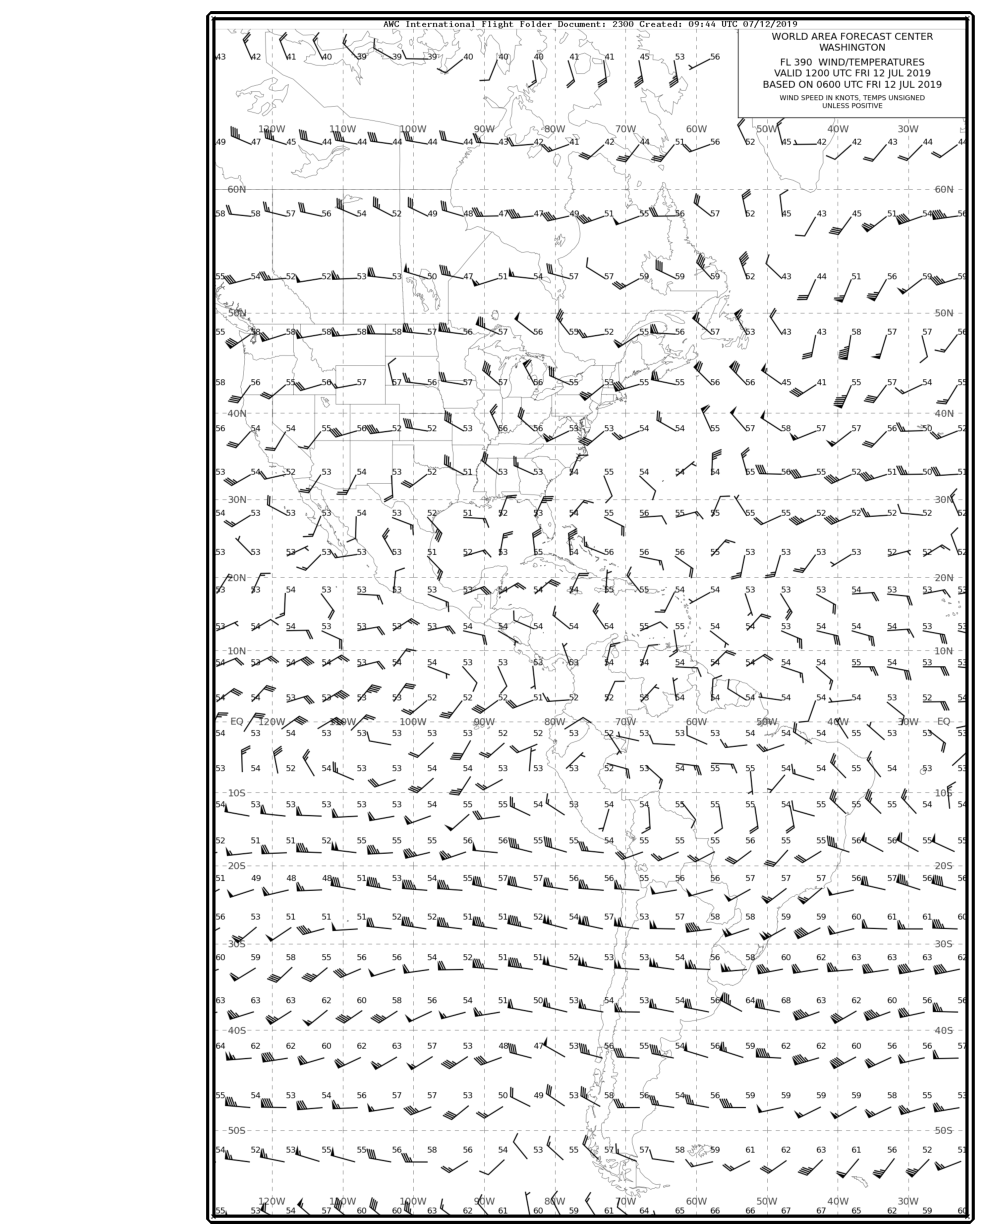
Long-haul and transoceanic flight planning depends on reliable, standardized meteorological data that crosses national boundaries without ambiguity. The World Area Forecast System (WAFS) was established specifically to meet that need, providing globally consistent gridded forecasts of winds, temperatures, and significant aviation hazards for flight planning and in-flight decision-making. Governed by the International Civil Aviation Organization (ICAO) and produced cooperatively by two World Area Forecast Centers (WAFCs) — one operated by the United States (NOAA/NWS) and one by the United Kingdom (UK Met Office) — WAFS products are the international standard for upper-level flight planning data above the domestic scale.
As described in the FAA Aviation Weather Handbook (FAA-H-8083-28B), Chapter 27, WAFS forecasts are one of many forecast categories available to pilots and dispatchers, sitting alongside products such as Terminal Aerodrome Forecasts (TAFs), Significant Weather (SIGWX) charts, and domestic winds-aloft (FB winds) products. Understanding WAFS, how to read its outputs, and why it supersedes older text-based products is essential knowledge for instrument pilots, airline operations personnel, and anyone planning flight at the upper levels.
How the World Area Forecast System Works
WAFS operates through two redundant WAFCs — Washington (operated by NOAA) and London (operated by the UK Met Office). Each center independently produces global gridded forecasts and distributes them via satellite broadcast and internet-based delivery (SADIS for London, and the internet-based WIFS — WAFS Internet File Service — for Washington). Pilots and dispatchers can access WAFS data through official aviation weather portals, including the Aviation Weather Center (AWC) website. The dual-center design provides redundancy: if one WAFC becomes unavailable, the other continues to supply the global aviation community with uninterrupted forecast data.
WAFS outputs are produced using Numerical Weather Prediction (NWP) models that ingest observations from radiosondes, satellite soundings, pilot reports (PIREPs), aircraft data (ACARS), and other sources. The models generate forecasts on a global grid at multiple pressure levels, covering altitudes from the lower atmosphere up through approximately FL630 (63,000 feet). These gridded binary-format products (distributed in GRIB2 format) are directly ingested by flight planning software, making the data immediately useful without manual decoding.
WAFS Wind and Temperature Forecasts
WAFS wind and temperature grids are the international counterpart to the domestic FB Winds product. Where FB winds cover CONUS, Hawaii, Alaska, and limited coastal waters at scattered station locations with updates only four times daily, WAFS provides global coverage on a dense grid with forecast data at multiple pressure levels. The WAFS wind and temperature data is available at pressure levels corresponding to flight levels from the low levels up through the tropopause and stratosphere, typically at intervals aligned with standard ICAO flight levels. Modern flight planning systems use these gridded winds directly to compute optimum routes, estimated times of arrival, and fuel burn — tasks the old coded text tables were never designed to support at global scale.
WAFS Hazard Forecasts: Icing, Turbulence, and Cumulonimbus
Beyond wind and temperature, WAFS delivers three critical hazard forecast grids that distinguish it from simple winds-aloft products:
- Icing severity and supercooled large droplet (SLD) potential: WAFS icing forecasts provide gridded guidance on where aircraft structural icing is expected, at what altitudes, and at what intensity. This includes identification of areas with supercooled large droplets — a particularly hazardous icing environment that can defeat certain de-icing systems.
- Turbulence severity: WAFS turbulence grids forecast the location and intensity of turbulence, including both convectively induced and clear-air turbulence (CAT). CAT at cruise altitudes poses a serious risk to passengers and crew and is invisible to airborne weather radar, making forecast guidance indispensable.
- Cumulonimbus (CB) activity: WAFS forecasts the location, coverage, and tops of significant cumulonimbus development worldwide. Cb activity is one of the primary hazards on transoceanic routes, particularly in equatorial regions, and WAFS CB guidance feeds directly into Significant Weather (SIGWX) chart production.
These hazard grids are produced as gridded binary files that flight planning software, airline dispatch systems, and weather service providers can overlay on route analysis tools. The granularity and global extent of WAFS hazard products far exceed what regional text-based forecasts can provide.
Relationship to SIGWX Charts
WAFS data is the backbone of the Significant Weather (SIGWX) forecast charts — the graphical products that pilots and dispatchers study before international departures. High-Level SIGWX charts cover FL250 to FL630, Mid-Level charts cover FL100 to FL450, and Low-Level SIGWX charts address below FL250. These charts depict the location of cumulonimbus, jet streams, tropopause heights, turbulence areas, and icing areas — all derived from the WAFS model grids. The charts are distributed in both graphical and gridded digital formats, with digital formats increasingly preferred by automated flight planning systems. While a pilot briefing for a transatlantic flight will often review the graphical SIGWX chart, the underlying data originates in the WAFS grid.
Why WAFS Matters Operationally
For domestic operations below FL180 in the CONUS, pilots commonly rely on domestic NWS products: FB winds, TAFs, AIRMETs, SIGMETs, and the Graphical Forecasts for Aviation (GFA) tool. Once a flight crosses into international airspace — or climbs to the upper levels of the CONUS on a transcontinental route — WAFS products become the authoritative source. Regulatory and ICAO requirements for certain international flight operations specify the use of WAFS-derived meteorological data for preflight planning, and airline operations specifications typically reference WAFS-compatible data sources.
On a practical level, WAFS wind data directly affects fuel planning. An error of even 20 knots in forecasted headwind on a 10-hour transoceanic flight can translate to hundreds of pounds of fuel. Icing and turbulence forecasts from WAFS allow route planners to select altitudes that minimize hazard exposure, reducing passenger injury risk and structural fatigue. CB forecasts allow dispatchers and crews to anticipate areas of convective weather that may require significant route deviations, and to coordinate with air traffic control in advance.
Key Numbers and Rules
- Two WAFCs: Washington (NOAA/NWS) and London (UK Met Office) — each produces independent global grids; the dual-center structure ensures redundancy.
- Vertical coverage: WAFS wind and temperature forecasts extend from low levels up through approximately FL630, covering all ICAO standard flight levels.
- GRIB2 format: WAFS forecast data is distributed in gridded binary (GRIB2) format for direct machine ingestion by flight planning software.
- Three primary hazard products: icing (including SLD), turbulence (including CAT), and cumulonimbus (CB) — each produced as a global grid.
- FB winds update limitation: By contrast, domestic FB winds are issued only four times daily and cover scattered station locations 100–150 miles apart — illustrating why WAFS grids are superior for global and high-altitude planning.
- SIGWX chart levels: High-Level covers FL250–FL630; Mid-Level covers FL100–FL450; Low-Level covers below FL250 — all derived from WAFS data.
- Distribution networks: SADIS (Satellite Distribution System, operated by London) and WIFS (WAFS Internet File Service, operated by Washington) are the official WAFS distribution channels, supplemented by internet delivery.
Common Test Traps
- Confusing WAFS with FB winds: FB winds are a domestic product covering CONUS and nearby areas at fixed station locations, updated four times daily. WAFS provides global gridded data used for international and high-altitude flight planning — they are not the same product.
- Assuming WAFS only covers winds and temperatures: WAFS also produces hazard forecasts for icing, turbulence, and CB activity — these hazard grids are a core WAFS deliverable, not a separate system.
- Mixing up WAFS and SIGWX: SIGWX charts are the graphical product derived from WAFS data, but WAFS itself is the underlying gridded numerical forecast system. The chart is the visualization; WAFS is the source.
- Overlooking the two-WAFC structure: Questions may ask which organizations produce WAFS. The answer is two WAFCs — Washington and London — not a single agency.
- Assuming FB winds are adequate for transoceanic planning: FB winds are explicitly described in FAA-H-8083-28B as limited in update frequency (4x/day), station spacing (100–150 mi), and geographic extent. WAFS fills the global gap, and modern flight planning software uses WAFS-derived model grids rather than FB winds text tables.