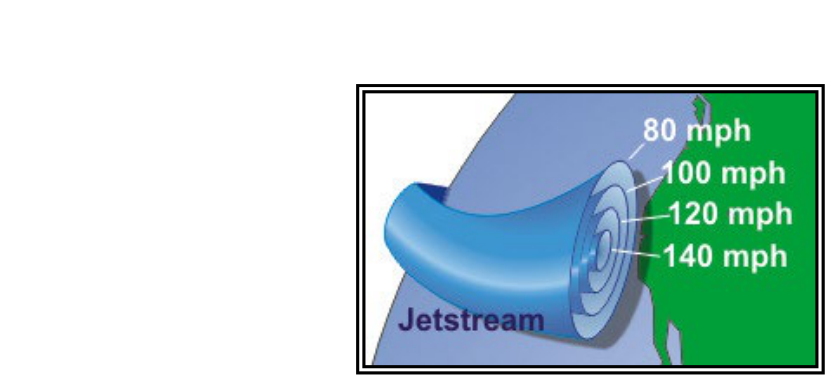
At the altitudes where turbine-powered transport aircraft routinely cruise—generally between FL280 and FL450—the atmosphere is governed by forces and phenomena that have little counterpart in the surface environment most pilots first studied. Near and above the tropopause, powerful ribbons of wind called jet streams dominate fuel planning, route selection, turbulence avoidance, and even the legal dispatch of an airliner. For the Airline Transport Pilot certificate, a deep understanding of these winds is not optional: it appears in weather-related test items, oral examinations, and—most importantly—in daily operational decisions that directly affect safety and cost.
The Tropopause: A Dynamic, Not Fixed, Boundary
The tropopause is the dividing layer between the troposphere below and the stratosphere above. It is not a single, flat surface. In mid-latitudes it typically sits between roughly 36,000 and 40,000 feet MSL, while over the equator it can extend to approximately 55,000 feet. Over the poles it may be as low as 25,000 feet. These height differences matter because jet streams form specifically in regions where the tropopause drops sharply in height—called a tropopause break—creating steep horizontal temperature gradients. According to the Aviation Weather Handbook (FAA-H-8083-28), the intensity of upper-level winds is directly related to the strength of the horizontal temperature gradient beneath them. The greater the temperature contrast across a frontal zone, the faster the winds in the jet above it.
Above the tropopause, in the stratosphere itself, temperature stops decreasing with altitude and begins to increase as ozone absorbs ultraviolet solar radiation. This temperature inversion creates an extremely stable layer that suppresses convective weather. Cumulonimbus clouds cannot penetrate deep into the stratosphere, which is why overshooting tops that punch through the tropopause are a signal of extraordinarily intense convection below. For long-haul operations, cruise altitudes in the lower stratosphere offer smooth, convection-free air—but winds must still be evaluated carefully.
Jet Stream Structure and Types
A jet stream is a concentrated, quasi-horizontal tube of high-speed winds that flows generally from west to east across mid-latitudes. The FAA's Aviation Weather Handbook identifies the two jet streams most relevant to U.S. operations:
- Polar jet stream: Located roughly between 30°N and 70°N latitude, depending on season. It migrates northward in summer and southward in winter, following the polar front. Wind speeds routinely exceed 100 knots and can surpass 200 knots during deep winter. This jet is directly associated with frontal systems, cyclogenesis, and significant en-route weather.
- Subtropical jet stream: Found near 20°N–30°N latitude, typically at higher altitudes than the polar jet (often above FL350). It is generally more steady and less variable than the polar jet, and is not as directly tied to surface frontal activity. It is, however, a significant factor in transpacific and Caribbean routing.
The jet core—the zone of maximum velocity—is surrounded by wind shear on all sides. Vertical shear exists above and below the core; horizontal shear exists on both the northern (poleward) and southern (equatorward) flanks. Understanding this three-dimensional shear envelope is critical because shear is the mechanism that generates clear-air turbulence (CAT).
Clear-Air Turbulence: Cause, Location, and Detection
CAT is high-altitude turbulence that occurs in cloudless air with no visible weather cues. It is produced by wind shear—particularly where fast-moving jet-stream air rubs against slower-moving air on the edges of the core. The Aviation Weather Handbook notes that CAT is most frequently encountered within approximately 150 nautical miles of the jet core, with the northern (poleward) side and the region just above the core being the highest-risk zones. The southern flank and the core center are less prone to CAT intensity, though not immune.
Because CAT is invisible and not detected by standard airborne weather radar (which requires precipitation), pilot reports (PIREPs) are the most operationally valuable real-time information source. Dispatchers and meteorology departments monitor PIREPs continuously. From the flight deck, an abrupt onset of turbulence with clear skies, especially near the known jet position, is a strong indicator of CAT. AIM Chapter 7 provides guidance on reporting turbulence intensity using standardized terminology (light, moderate, severe, extreme) to ensure PIREPs are actionable for other crews.
Fuel Efficiency: Why Jet Stream Routing Dominates Dispatch Planning
Fuel is the dominant direct operating cost for any airline, and upper-level winds at cruise altitude can represent the difference between a profitable flight and one that requires a fuel stop. A 100-knot tailwind increases groundspeed and reduces fuel burn per nautical mile by a proportional amount; a 150-knot headwind has the opposite effect, potentially forcing reduced payload, additional fuel stops, or route changes. The economic stakes are enormous on transatlantic and transpacific routes where fuel loads already approach structural limits.
Dispatchers and crews evaluate winds at multiple pressure altitudes using upper-level wind forecast charts. The most relevant prognostic (prog) charts for jet-level operations are at 300 mb (approximately FL300), 250 mb (approximately FL340), and 200 mb (approximately FL390). These charts display isotachs (lines of equal wind speed), jet stream positions, and tropopause heights. By comparing winds across flight levels, the dispatcher can identify a minimum-time track (MTT) or a minimum-cost track, which may differ depending on fuel price versus time cost at the airline's operation.
Accepting a non-great-circle route is a routine consequence of jet stream optimization. A flight from the U.S. East Coast to Europe may fly a more northerly arc in winter to intercept the polar jet tailwind, adding lateral distance but reducing flight time and fuel burn. Conversely, eastbound return flights may fly a more southerly route to avoid the same jet as a headwind. The North Atlantic Track System (NAT), jointly issued by Gander Oceanic and Shanwick Oceanic control, is rebuilt twice daily specifically around forecast jet stream positions. Similarly, Pacific Organized Track Systems (PACOTS) serve the same purpose over the North Pacific.
Coffin Corner and Altitude Optimization
Fuel efficiency does not simply mean flying as high as possible. At very high altitudes, the aircraft's aerodynamic performance envelope narrows dramatically. The indicated airspeed for low-speed stall buffet rises (because thinner air reduces lift), while the Mach number for high-speed buffet decreases. The narrow band between these two limits is called coffin corner. An aircraft pushed too close to coffin corner has little margin to handle turbulence-induced airspeed excursions or the airspeed changes required for maneuvering. The Instrument Flying Handbook (FAA-H-8083-15) and the PHAK (FAA-H-8083-25) both address Mach buffet and the importance of not exceeding maximum operating Mach number (MMO).
Optimal cruise altitude therefore balances three competing factors: aerodynamic efficiency (best specific range), wind benefit at altitude, and structural/aerodynamic margins. Flight management systems (FMS) aboard modern transport aircraft continuously recalculate the optimum and maximum cruise altitudes as weight decreases with fuel burn, allowing step climbs to capture progressively better performance as the flight progresses. In RVSM airspace (FL290–FL410), standard vertical separation between adjacent levels is 1,000 feet, and step climbs are typically planned in 2,000- or 4,000-foot increments to move to a more favorable flight level while remaining within approved RVSM flight levels.
Key Numbers and Rules to Know
- Jet streams are typically found between 25,000 and 45,000 feet MSL, near the tropopause.
- Polar jet speeds commonly exceed 100 knots and may surpass 200 knots in winter.
- The tropopause height ranges from approximately 25,000 ft over the poles to 55,000 ft over the equator.
- CAT risk is highest within roughly 150 nm of the jet core, on the poleward side and just above the core.
- RVSM airspace (FL290–FL410) requires 1,000-foot vertical separation and approved equipment; step climbs are typically planned in 2,000- or 4,000-foot increments.
- Upper-level wind charts at 300, 250, and 200 mb are the primary tools for jet-level wind analysis.
Common Test Traps
- CAT location: Distractors often place CAT on the southern flank or inside the core. The correct answer is the northern (poleward) flank and just above the core.
- Jet stream flow direction: Mid-latitude jets flow west to east as a prevailing direction. Curved segments may have northward or southward components, but the dominant direction is always westerly.
- Tropopause height and jet intensity: The jet is strongest where the tropopause drops most steeply—over the polar front in winter, not over the equator where the tropopause is highest but the temperature gradient is weakest.
- Seasonal strength: The polar jet is stronger in winter; don't confuse this with summertime convective turbulence, which peaks in warm months but at lower altitudes and for entirely different meteorological reasons.
- Subtropical vs. polar jet: The subtropical jet is more persistent and consistent; the polar jet is more variable and directly tied to frontal weather. Questions may swap these characteristics.
- PIREPs for CAT: Weather radar does NOT detect CAT because there is no precipitation to reflect the beam. PIREPs are the primary real-time source.
Memory Aid
A widely used instructor mnemonic for CAT avoidance: "North and Above — Stay Below." This reminds you that CAT concentrates on the poleward (northern) side and just above the jet core, so routing slightly south and below the core reduces CAT exposure while still capturing useful tailwind benefit from the southern edge of the jet.