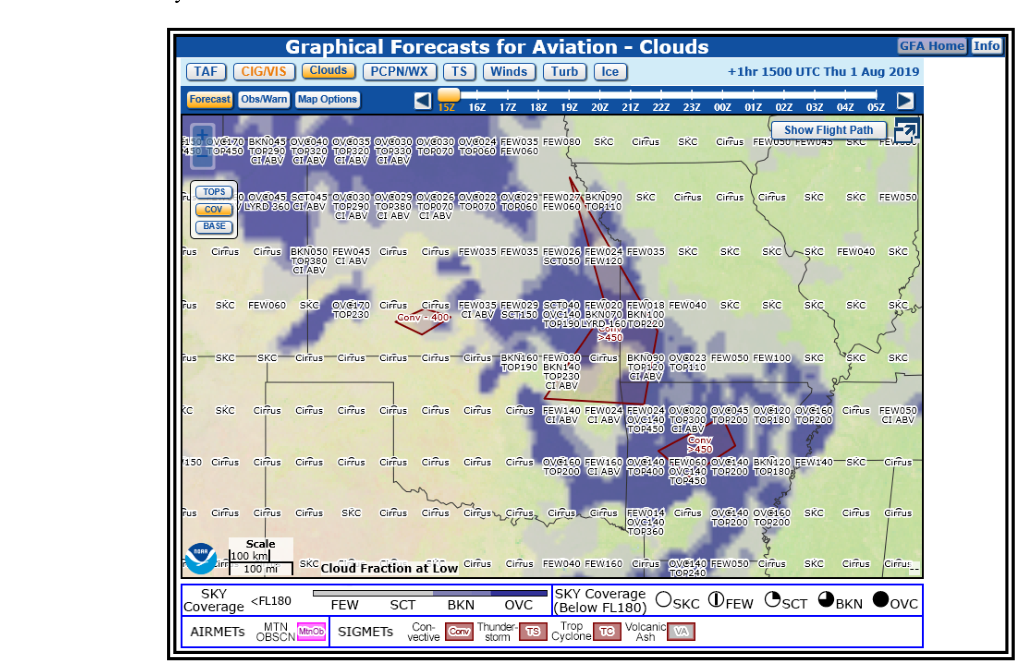
Before 2017, pilots seeking an area-wide weather picture had to wade through dense blocks of coded text in the Area Forecast (FA). The FAA and National Weather Service (NWS) replaced that product with the Graphical Forecasts for Aviation (GFA) Tool — an interactive, web-based platform that presents forecast weather data in an intuitive, map-based format covering the contiguous United States (CONUS), southern Alaska, and the coastal waters. For student pilots preparing for the FAA knowledge test and, more importantly, for real preflight planning, understanding what the GFA tool offers and how to read it correctly is essential.
The GFA tool is available through the Aviation Weather Center (AWC) website and is now the official source for the information that was formerly found in the textual FA. Rather than decoding cryptic abbreviations, you interact with overlaid graphical layers, time sliders, and clickable data points to build a complete mental picture of forecast conditions along your route of flight.
How the GFA Tool Works
The GFA tool is built around a time slider that lets you step through forecasts in one-hour increments. The tool covers forecast periods out to 15 hours for most weather elements, with an extended outlook available out to 18 hours in some layers. This temporal flexibility is one of the tool's greatest advantages — you can look at conditions at your departure time, at your estimated time en route, and at your planned arrival time, all on the same platform.
The display is organized into several selectable weather layers, each toggled on or off independently. The major categories include:
- Clouds: Forecast sky coverage (clear, few, scattered, broken, overcast) along with cloud base heights (AGL) and tops (MSL). You can see where ceilings are forecast to drop below VFR minimums at a glance.
- Weather: Precipitation type and intensity, thunderstorm coverage (isolated, scattered, numerous), and obscurations such as fog, haze, or smoke that can reduce visibility.
- Wind and Temperature: Forecast winds aloft at selectable altitudes (typically 3,000 ft through FL480), shown as wind barbs on the map. Temperature at altitude is also displayed, critical for density altitude calculations and icing assessment.
- Icing: Forecast icing type (supercooled large drops, freezing drizzle, rime, mixed) and severity (trace, light, moderate, severe), displayed as shaded areas at selectable altitudes. This layer draws from the Current Icing Product (CIP) and Forecast Icing Product (FIP) data.
- Turbulence: Forecast turbulence severity (light, moderate, severe, extreme) and type (clear air, mountain wave, convective), derived from the Graphical Turbulence Guidance (GTG) product. Like icing, it is displayed at selectable altitudes.
- Precipitation: A composite radar mosaic blended with forecast data showing current and anticipated precipitation across the CONUS.
When you click on any point on the map, the tool generates a meteogram — a time-versus-altitude cross-section showing how cloud layers, icing potential, and turbulence change at that location over the entire forecast period. This vertical profile view is extremely powerful for understanding what conditions look like at different flight altitudes and across the time of your flight.
Why the GFA Tool Matters
The GFA tool matters for three interconnected reasons: regulatory compliance, safety of flight, and aeronautical decision-making (ADM).
From a regulatory standpoint, 14 CFR Part 91.103 requires pilots to familiarize themselves with all available information concerning a flight before departure. For any flight not in the vicinity of an airport, that includes weather reports and forecasts. The GFA tool is now the primary official source for forecast weather over broad areas, making it a go-to resource for regulatory compliance during preflight planning.
From a safety standpoint, the GFA gives you a much richer picture than a textual product ever could. By stepping through the time slider, you can see a developing line of convection that might not exist at your departure time but could be squarely across your route an hour later. The ability to visualize trends — a ceiling lifting, icing levels dropping, winds shifting — transforms weather briefing from a static snapshot into a dynamic, time-aware assessment.
From an ADM standpoint, the GFA is one of the best tools for applying the PAVE risk-identification checklist. The Pilot element (your experience and currency), the Aircraft element (equipment and limitations), and the enVironment element (weather, terrain, airspace) all benefit from the layered information the GFA provides. When the icing layer shows moderate icing at your planned altitude over a mountain crossing, the GFA is giving you the environmental data you need to make an informed go/no-go decision.
Key Numbers and Rules
- The GFA tool provides forecast data in one-hour time steps out to 15 hours for clouds and weather, and up to 18 hours for some extended products.
- Cloud heights in the GFA cloud layer are displayed as bases in feet AGL and tops in feet MSL — pay attention to which reference is being used.
- Winds aloft displayed in the GFA are given in true north orientation (as are all winds aloft products), unlike surface winds in METARs and TAFs which are magnetic.
- The GFA tool covers the contiguous United States (CONUS) as its primary domain; Alaska and offshore waters have separate or supplemental products.
- The GFA replaced the legacy textual Area Forecast (FA) for the CONUS in October 2017.
- Turbulence severity in the GFA follows the standard ICAO/FAA scale: light, moderate, severe, and extreme.
- Icing severity follows the scale of trace, light, moderate, and severe — any forecast of moderate or severe icing should be treated as a hard no-go for an aircraft without anti-icing or de-icing equipment.
Memory Aid
The PAVE checklist is the standard FAA mnemonic for identifying risk during preflight planning, and the GFA tool directly feeds the E — enVironment element:
- P — Pilot: Am I current, proficient, and fit for this flight?
- A — Aircraft: Is the aircraft equipped and airworthy for forecast conditions?
- V — enVironment: What does the GFA say about ceilings, visibility, icing, and turbulence along the route?
- E — External Pressures: Are there schedule or personal pressures pushing me toward a go when conditions argue for no-go?
When you open the GFA tool, think PAVE. Let the V — environment — layers inform every other element of the checklist.
Common Test Traps
- Confusing cloud base and top references: The FAA knowledge test and the GFA tool itself display cloud bases in feet AGL and cloud tops in feet MSL. Mixing these up leads to incorrect clearance calculations and is a classic exam error.
- Treating GFA winds as magnetic: All winds aloft products, including those in the GFA, are referenced to true north. Surface winds in METARs and ATIS are magnetic; TAF winds, like winds aloft, are referenced to true north. Applying a GFA wind directly to a magnetic heading calculation without correcting for variation is a common conceptual mistake.
- Assuming the GFA covers Alaska fully: The GFA's primary CONUS-based graphical system does not identically cover Alaska. Test questions about Alaska weather products may reference different or supplemental sources.
- Underestimating icing severity language: On the knowledge test, any forecast of moderate or severe icing is a no-go condition for a non-equipped aircraft. Students sometimes read "light" icing as acceptable for any aircraft, but even trace to light icing can be hazardous in aircraft without any equipment, especially during extended flight.
- Confusing forecast period lengths: The GFA provides data out to 15–18 hours, not 24 hours. Some students confuse the GFA forecast window with the 24-hour TAF period or the older FA's 12/18-hour structure. Know that the GFA time horizon is 15 hours for most standard layers.
The GFA tool represents a genuine leap forward in how pilots access and interpret forecast weather. By learning to work confidently through its layers — clouds, weather, icing, turbulence, and winds aloft — you build exactly the kind of systematic preflight weather picture that the FAA expects from a competent private pilot. Make it a standard step in every preflight planning session, not just an exam topic, and it will pay dividends in both safety and situational awareness every time you fly.