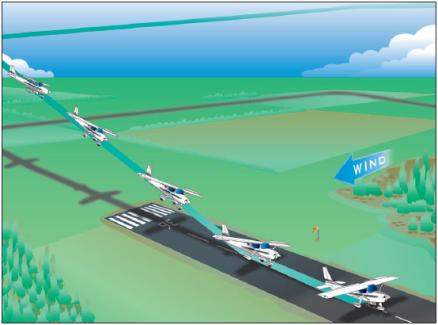
Every pilot learns early that wind is not just a navigational consideration — it is a fundamental performance variable that changes how much runway you need to get airborne and how much you need to stop. Fail to account for a strong tailwind on departure, and what looked like a comfortable margin on paper can evaporate in the first few seconds of the takeoff roll. The FAA expects every private pilot candidate to understand exactly how wind alters performance figures, what the regulatory guidance says about corrections, and how to apply that knowledge to real runway-length calculations.
This article unpacks the physics behind wind's effect on takeoff and landing distances, walks through the correction methods published in FAA-approved Pilot's Operating Handbooks (POHs), and highlights the specific numbers and test traps you will encounter on the Private Pilot Aeronautical Knowledge Exam.
Why Airspeed — Not Ground Speed — Is What the Airplane Cares About
An airplane lifts off when its wings generate enough lift to exceed its weight. Lift depends on airspeed — the speed of air flowing over the wings — not on how fast the wheels are rolling across the pavement. This distinction is the root of everything that follows. When you take off into a headwind, your airspeed is already higher than your ground speed before you even begin moving. The wings reach flying speed sooner, at a lower ground speed, which means a shorter ground roll and less runway consumed.
A tailwind works in the opposite direction. Now you must accelerate the airplane to a higher ground speed before airspeed reaches lift-off velocity. Every knot of tailwind adds to the ground roll and to the distance needed to climb over an obstacle. The effect is not linear — it is multiplicative — and that non-linear nature is precisely what catches pilots off guard.
Headwind: How It Shortens the Required Distance
Imagine a small trainer with a lift-off speed of 55 knots indicated airspeed (KIAS). On a calm day, the airplane must accelerate from zero to 55 knots of ground speed to become airborne. Now add a 10-knot headwind: the airplane starts with 10 knots of airspeed already, so it only needs to add 45 more knots of ground speed. Less acceleration distance is needed, the ground roll is shorter, and the aircraft clears a 50-foot obstacle in a shorter horizontal distance as well.
The Pilot's Handbook of Aeronautical Knowledge (PHAK) notes that a headwind equal to roughly 10 percent of the lift-off speed will reduce takeoff distance by approximately 19 percent. That is a meaningful reduction, but notice it is not 10 percent — it is nearly double that. Wind's effect on performance is disproportionate.
For landing, the same logic applies: arriving over the threshold with a headwind means your ground speed is lower than your indicated airspeed, so you are already traveling slower across the pavement when you touch down. The rollout needed to decelerate to a stop is therefore shorter.
Tailwind: How It Lengthens the Required Distance
A tailwind adds to your ground speed without adding to your airspeed. On takeoff, the airplane must now accelerate to a ground speed higher than the lift-off airspeed in order to actually reach that airspeed. The PHAK offers a stark benchmark: a tailwind equal to 10 percent of the lift-off speed increases the takeoff distance by approximately 21 percent. Extend the tailwind to just a few more knots — say, enough to represent a significant fraction of lift-off speed — and the required runway can increase by 50 percent or more.
On landing, a tailwind pushes you down the runway faster. Your ground speed at touchdown is higher than your indicated airspeed, kinetic energy is higher (recall that kinetic energy increases with the square of velocity), and you need substantially more runway to decelerate. Braking and aerodynamic drag must overcome more momentum. A 10-knot tailwind on landing can increase landing roll by 21 percent or more — again, a disproportionate effect.
This is why 14 CFR Part 91 and most POHs treat tailwind operations with special caution. Many POH performance charts simply do not provide data for tailwinds exceeding 10 knots; attempting such an operation places you outside published performance data entirely.
Crosswind Components and Effective Headwind
Real-world wind is rarely aligned perfectly with the runway centerline. When wind strikes the runway at an angle, its effect on takeoff and landing performance must be broken into two components using basic trigonometry: the headwind component (parallel to the runway, which is the performance-relevant portion) and the crosswind component (perpendicular to the runway, which creates handling challenges but does not reduce ground roll the way a direct headwind does).
To find the headwind component, multiply the total wind speed by the cosine of the angle between the wind direction and the runway heading. To find the crosswind component, multiply total wind speed by the sine of that angle. POHs and airport facility directories publish the demonstrated crosswind component — the maximum direct crosswind in which the airplane has been demonstrated to be controllable — but this is not a regulatory limit; it is a manufacturer's flight-test figure. Pilots must assess their own skill level accordingly.
A wind component chart (also called a crosswind component chart) allows quick graphical resolution of these components without a calculator. FAA knowledge tests frequently present a wind condition and ask you to identify the headwind and crosswind components from such a chart.
Reading Performance Charts: The Standard Correction Method
Most POH performance sections provide takeoff and landing distance data for a no-wind condition and then supply notes explaining how to adjust for wind. The most common guidance follows a rule of thumb endorsed by the FAA:
- Headwind correction: Decrease the no-wind distance by approximately 10 percent for every 9 knots of headwind component, depending on the specific aircraft.
- Tailwind correction: A 10-knot tailwind component can increase the no-wind distance by approximately 21 percent, depending on the specific aircraft — tailwind penalties are disproportionately larger than the equivalent headwind benefit.
These are general approximations. The authoritative numbers always come from the specific aircraft's POH performance charts. Some POHs provide a wind correction table or graph; others require you to interpolate. Always use the most conservative (largest) correction when interpolating between chart values.
A practical example: suppose a POH shows a ground roll of 800 feet in no-wind conditions. You are departing with a 15-knot direct headwind. Using the chart's guidance (assume a 10% reduction per 9 knots of headwind), you would reduce the ground roll by roughly 16–17 percent, arriving at approximately 665–670 feet. If instead you had a 10-knot tailwind, you might increase the no-wind figure by 21 percent or more, bringing required ground roll to roughly 970 feet — almost 170 additional feet just from the tailwind.
Regulatory and Safety Considerations
Under 14 CFR §91.103, pilots in command are required, before every flight, to become familiar with all available information concerning that flight — including runway lengths and takeoff and landing distance data. There is no regulation that mandates a specific headwind or prohibits a specific tailwind in Part 91 operations (other than aircraft-specific limitations in the POH), but the pilot in command bears full responsibility for determining that the runway is adequate under the prevailing conditions.
The FAA strongly recommends building a personal safety margin beyond the charted figures. POH performance data is generated by test pilots, in new aircraft, under ideal conditions. Real-world variables — a pilot who is not as precise on technique, an aircraft that has accumulated wear, or a runway surface that is not perfectly smooth — all erode your margin. Adding at least a 50 percent buffer to computed takeoff distance and a similar buffer to landing distance is widely recommended as good airmanship, especially for short or obstacle-laden strips.
Key Numbers and Rules
- A headwind of approximately 10% of lift-off speed reduces takeoff distance by roughly 19%.
- A tailwind of approximately 10% of lift-off speed increases takeoff distance by roughly 21%.
- Tailwind effects on landing roll mirror those on takeoff — a 10-knot tailwind can add 21% or more to landing distance.
- Most POHs do not publish performance data for tailwinds exceeding 10 knots.
- The headwind component = wind speed × cosine of the wind angle to the runway.
- The crosswind component = wind speed × sine of the wind angle to the runway.
- 14 CFR §91.103 requires preflight familiarity with runway lengths and takeoff/landing performance data.
- The demonstrated crosswind component in a POH is a flight-test value, not a regulatory maximum.
Memory Aid
"Head helps, Tail hurts — and the effect is BIGGER than the wind itself." This simple reminder captures two key ideas: (1) a headwind helps performance by reducing ground roll, while a tailwind hurts it by increasing ground roll; and (2) the percentage change in distance is always larger than the wind's percentage of lift-off speed — the relationship is non-linear. If you remember that a 10% tailwind (as a fraction of lift-off speed) produces more than a 20% increase in distance, you will never underestimate tailwind danger on a short runway.
Common Test Traps
- Assuming wind effects are linear. The FAA tests whether you know that a tailwind equal to 10% of lift-off speed increases distance by about 21%, not 10%. The relationship is non-linear because kinetic energy scales with velocity squared.
- Using total wind speed instead of the headwind component. A 20-knot wind at 60° to the runway gives a headwind component of only about 10 knots (20 × cos 60° = 10). Using the full 20 knots would give you an overly optimistic performance estimate.
- Thinking the demonstrated crosswind component is a hard regulatory limit. It is a flight-test figure. Exceeding it is not automatically illegal under Part 91, but it is extremely dangerous and the pilot bears full responsibility.
- Forgetting obstacle clearance distance vs. ground roll. The test often distinguishes between the ground roll to lift-off and the total distance to clear a 50-foot obstacle. Tailwinds and headwinds affect both, but the obstacle clearance figure is always larger and grows more dramatically with adverse wind.
- Neglecting to apply corrections when interpolating chart data. If the wind falls between chart entries, always interpolate — never simply use the nearest lower wind value, which would underestimate the required distance.