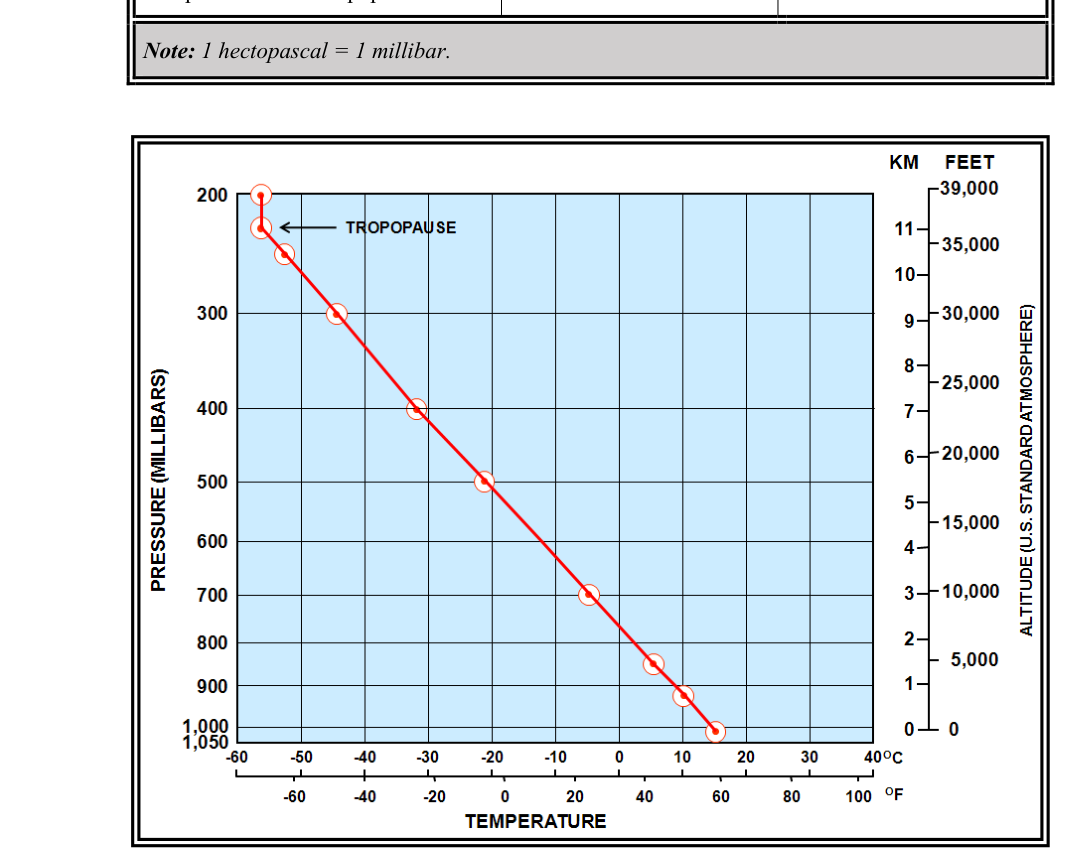
Every performance chart in your Pilot's Operating Handbook (POH) was built on a specific set of assumptions about the atmosphere. Those assumptions form the International Standard Atmosphere (ISA), a mathematical model that defines how temperature, pressure, and air density change with altitude under "standard" conditions. When the real atmosphere differs from ISA — as it almost always does — your aircraft's performance will deviate from the book values. Understanding ISA deviation is not just an exam skill; it is a fundamental tool for honest preflight planning.
The FAA addresses the standard atmosphere model throughout the Pilot's Handbook of Aeronautical Knowledge (PHAK) and the Airplane Flying Handbook (AFH), and it underpins every density altitude, true airspeed, and climb-performance calculation you will ever make.
What the Standard Atmosphere Defines
The ISA (also called the ICAO Standard Atmosphere) establishes a precise set of sea-level reference values and describes how those values change with altitude. The key sea-level standard conditions are:
- Temperature: 15 °C (59 °F)
- Pressure: 29.92 inches of mercury (inHg), or 1013.25 millibars / hectopascals
- Air density: approximately 0.002377 slugs per cubic foot (the value embedded in all performance charts)
- Lapse rate: Temperature decreases at 2 °C per 1,000 feet (roughly 3.5 °F per 1,000 feet) as you climb through the troposphere
Because pressure and density also decrease with altitude — though not at a perfectly linear rate — the ISA defines a complete "column" of atmosphere from sea level upward. Every altitude on a performance chart is referenced to this column. When a chart says your airplane will climb at 700 feet per minute at 4,000 feet density altitude, it means 700 fpm in air that matches ISA conditions at 4,000 feet: using the standard lapse rate, that works out to approximately 7 °C at a pressure altitude of 4,000 feet, though this is an approximation that assumes the standard 2 °C per 1,000 feet lapse rate holds exactly.
Pressure Altitude vs. Density Altitude
Two altitude concepts flow directly from ISA and are constantly tested:
Pressure altitude is the altitude indicated when you set your altimeter to the standard datum of 29.92 inHg. It tells you where you are in the ISA pressure column, ignoring local temperature. Pressure altitude is used as the entry argument for most performance tables, and it is what a Mode C transponder encodes when it reports your altitude to ATC.
Density altitude is pressure altitude corrected for non-standard temperature. It represents the altitude in the standard atmosphere that has the same air density as your current environment. If the air is warmer than ISA at a given pressure altitude, it is less dense than standard, so the density altitude is higher than the pressure altitude. Density altitude is the single most important number for performance: engines, propellers, and wings all respond to air density, not to the numbers on a chart.
The practical formula most pilots use is an approximation: density altitude ≈ pressure altitude + (120 × [actual temperature °C − ISA temperature °C]). The ISA temperature at a given pressure altitude equals 15 °C minus 2 °C for every 1,000 feet of pressure altitude. So at 5,000 feet pressure altitude, ISA temperature is 15 − 10 = 5 °C. If the actual temperature is 25 °C, the ISA deviation is +20 °C, and density altitude is approximately 5,000 + (120 × 20) = 7,400 feet.
ISA Deviation: The Core Concept
ISA deviation (sometimes written ΔISA or ISA+/ISA−) is simply the difference between the actual temperature at a given pressure altitude and the ISA standard temperature at that altitude. It is expressed in degrees Celsius above or below standard.
- ISA+20 means the air is 20 °C warmer than standard at that pressure altitude — less dense, worse performance.
- ISA−10 means the air is 10 °C colder than standard — more dense, better performance.
Jet operators and high-performance aircraft manufacturers often publish separate performance tables for ISA, ISA+10, ISA+20, and ISA+30 conditions. Even as a private pilot flying a Cessna 172, recognizing that a hot July afternoon in Phoenix is running ISA+25 or more will immediately tell you to expect significantly reduced climb rates, longer takeoff rolls, and higher true airspeeds at a given power setting.
Why Temperature Controls Performance
Air is the "working fluid" for every aerodynamic and powerplant system on your airplane. When temperature rises at a given pressure altitude:
- Density drops. Warmer air molecules move faster and spread out, reducing the mass of air in any given volume.
- Engine power drops. A naturally aspirated engine is essentially an air pump; less dense air means fewer oxygen molecules per intake stroke and therefore less fuel can be burned per cycle — power output decreases.
- Propeller efficiency drops. The propeller generates thrust by accelerating a mass of air rearward. With less dense air, the same propeller RPM accelerates less mass, producing less thrust.
- Lift requires a higher true airspeed. Because lift depends on air density, the wings must move faster through thinner air to generate the same lift force. This means longer ground rolls, because the airplane must reach a higher groundspeed before achieving the same indicated airspeed (IAS) for rotation.
All four effects compound each other on a hot, high-elevation airport. This is why density altitude accidents — runway overruns and failed climb-outs in mountainous western states — are tragically common in summer months.
Key Numbers and Rules
- ISA sea-level temperature: 15 °C / 59 °F
- ISA sea-level pressure: 29.92 inHg / 1013.25 mb
- Standard lapse rate: 2 °C per 1,000 feet (temperature only, in the troposphere)
- Pressure lapse rate: approximately 1 inHg per 1,000 feet near sea level (a useful approximation that decreases at higher altitudes and should not be applied uniformly throughout the atmosphere)
- Density altitude approximation: PA + (120 × ISA deviation in °C)
- Each 1,000-foot increase in density altitude above published field elevation degrades takeoff distance and reduces climb rate significantly — always check the POH performance section for specific numbers
- Above approximately 36,000 feet (the tropopause in ISA), temperature stops decreasing and remains constant at −56.5 °C — irrelevant for most private pilots but good context
Memory Aid
Many instructors teach the phrase "High, Hot, and Humid — performance is poor" to remember the three factors that raise density altitude and degrade performance:
- High — High pressure altitude (high-elevation airport or low barometric pressure)
- Hot — High temperature (large positive ISA deviation)
- Humid — High humidity (water vapor is less dense than dry air, slightly reducing density further)
Humidity's effect on density altitude is real but small compared to temperature and pressure, and the PHAK notes it is often left out of density altitude calculations rather than treated as a primary factor. The three-H reminder is a useful mnemonic, but for exam purposes remember that temperature and pressure altitude dominate the calculation.
Practical Application: Preflight Density Altitude Check
Before every flight, particularly in warm weather or at elevated airports, compute the density altitude. You can use a flight computer (E6B), a POH performance chart, or an electronic flight planning tool. The steps are straightforward: (1) obtain the current altimeter setting and convert field elevation to pressure altitude; (2) note the actual outside air temperature; (3) calculate the ISA temperature at that pressure altitude; (4) find the deviation and apply the approximation formula or use a density altitude chart. Then cross-reference the result with your POH takeoff and climb charts. If the density altitude exceeds the airport's published pattern or obstacle clearance assumptions significantly, consider delaying the flight to cooler morning hours, reducing weight, or choosing a longer runway.
Common Test Traps
- Confusing pressure altitude with density altitude. Pressure altitude ignores temperature; density altitude corrects for it. The FAA frequently presents scenarios where both numbers differ by thousands of feet.
- Applying the lapse rate to indicated altitude instead of pressure altitude. Always compute ISA temperature relative to pressure altitude, not field elevation (though the two are close when the altimeter setting is near standard).
- Assuming high humidity dramatically increases density altitude. Humidity's effect is real but small compared to temperature — the FAA expects you to know it contributes but not to treat it as the dominant factor.
- Forgetting that ISA deviation can be negative. Cold winter days at sea level may give ISA−15 or more, meaning denser air and better-than-book performance — an important safety margin most pilots overlook.
- Using indicated airspeed (IAS) to assess true performance penalties. The airplane's wings still stall at the same IAS regardless of density altitude, but the ground speed at stall is much higher in thin air — meaning less margin for error during takeoff and landing.