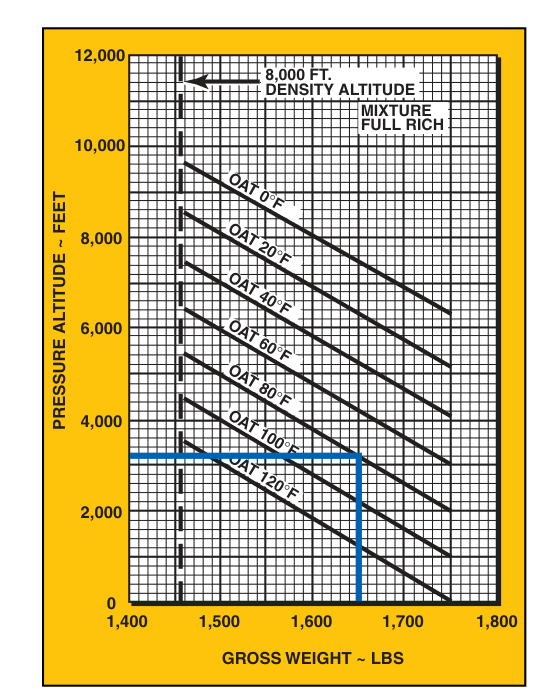
When you sit in the cockpit and glance at the altimeter, you see your indicated altitude—the altitude your instrument reads after you've dialed in the local altimeter setting. That number tells you where you are in the sky relative to sea level, and it's the number ATC cares about for separation. But when you flip open the Pilot's Operating Handbook (POH) and consult a takeoff distance chart or a climb performance table, the chart doesn't ask for your indicated altitude. It asks for pressure altitude. Understanding exactly why—and how to find and use pressure altitude correctly—is one of the most tested and practically important concepts in private pilot training.
The distinction matters because your airplane's engine, propeller, and wings don't know what the altimeter setting is. They only know how many air molecules are available per cubic foot. Pressure altitude is the index that best represents that available air mass under standard temperature conditions, making it the universal input for all performance calculations.
What Pressure Altitude Actually Means
Pressure altitude is defined as the altitude above the standard datum plane—the theoretical level at which atmospheric pressure equals 29.92 inches of mercury (inHg). In other words, pressure altitude answers the question: "If the whole atmosphere were arranged exactly as the International Standard Atmosphere (ISA) model predicts, at what altitude would this pressure naturally occur?"
The ISA model, which underpins all performance data, assumes sea-level pressure of 29.92 inHg, sea-level temperature of 15°C (59°F), and a lapse rate of approximately 2°C per 1,000 feet. Every performance chart in your POH was flight-tested against this standard. The charts don't assume you're flying on a standard day—they simply use pressure altitude as a common reference so you can apply temperature corrections on top of it.
Indicated altitude, by contrast, is the reading you get after setting the current local altimeter setting (the Kollsman window). When the setting is exactly 29.92, indicated altitude and pressure altitude are identical. When the local pressure differs from 29.92, the two numbers diverge. A higher-than-standard pressure (say, 30.42 inHg) means the atmosphere is denser at the surface; your altimeter, corrected to that setting, will read lower than pressure altitude. A lower-than-standard pressure (say, 29.42 inHg) means thinner air; indicated altitude will read higher than pressure altitude.
How to Find Pressure Altitude
There are two reliable methods to determine pressure altitude before a flight:
- Use the altimeter directly. Set 29.92 in the Kollsman window. Whatever the altimeter now reads is your pressure altitude for that field elevation. After noting the value, reset your altimeter to the current local setting before flight.
- Use the correction formula. The FAA provides a simple rule: for every 0.01 inHg that the altimeter setting deviates from 29.92, pressure altitude differs from field elevation by approximately 10 feet. Specifically, if the altimeter setting is below 29.92, add roughly 10 feet per 0.01 inHg difference. If it is above 29.92, subtract the same amount.
For example: your airport field elevation is 1,500 feet MSL, and the current altimeter setting is 29.72 inHg. The difference is 0.20 inHg below standard. Multiplied by 10 ft/0.01 inHg, that's 200 feet added. Your pressure altitude is approximately 1,700 feet. You would then use 1,700 feet—not 1,500 feet—when entering performance charts.
Density Altitude: The Next Step
Pressure altitude is the starting point, but density altitude is the finished product that truly represents aircraft performance. Density altitude is pressure altitude corrected for non-standard temperature. When the air is warmer than the ISA standard for a given pressure altitude, air density decreases—the air is thinner—and density altitude is higher than pressure altitude. Your engine produces less power, the propeller generates less thrust per revolution, and the wings require more groundspeed to generate the same lift.
The relationship is approximately: for every 1°C above standard temperature at a given pressure altitude, density altitude increases by roughly 118 to 120 feet (this is a widely used FAA rule-of-thumb approximation for quick mental estimates, not a precise constant—the actual relationship varies somewhat with pressure altitude). On a hot summer day at a high-elevation airport, density altitude can easily be 3,000 to 5,000 feet above the field elevation—meaning your aircraft performs as if it were at that much higher altitude even while sitting on the runway.
Most POH performance charts are structured so that you enter with pressure altitude and temperature together, allowing the chart to account for both effects simultaneously. Some older charts have you compute density altitude first using a flight computer or E6B, and then enter the chart with density altitude directly. Know which method your specific POH uses before flight.
Why It Matters for Performance Calculations
Every critical performance figure—takeoff ground roll, liftoff distance, obstacle clearance distance, climb rate, service ceiling, and cruise fuel burn—changes significantly with pressure altitude and temperature. Here's why this is safety-critical:
- Takeoff distance: Higher pressure altitude means lower air density. The engine produces less power, and the wings need a higher true airspeed to generate the same lift. Both effects lengthen the ground roll. A takeoff that is perfectly safe at sea level on a cool morning can exceed runway length on a hot afternoon at a mountain airport.
- Climb performance: Reduced power and lift mean a lower rate of climb and a reduced angle of climb. This directly affects obstacle clearance after departure. The climb rate you expect from memory—based on a sea-level standard-day training environment—may be substantially optimistic on a high-density-altitude day.
- Service ceiling: The absolute ceiling and service ceiling (where the aircraft can sustain only 100 fpm climb) are also density-altitude dependent. Attempting to reach a published cruise altitude may be impossible or dangerously slow in climb if conditions push density altitude close to those limits.
- Landing distance: Higher true airspeeds at the same indicated airspeed, combined with potentially shorter stopping distances (depending on surface and gradient), require careful chart consultation. Landing performance charts also use pressure altitude and temperature as inputs.
Key Numbers and Rules
- Standard sea-level pressure: 29.92 inHg (also expressed as 1013.25 mb or hPa)
- Standard sea-level temperature: 15°C (59°F)
- Standard lapse rate: approximately 2°C per 1,000 feet
- Altimeter correction rule: approximately 10 feet per 0.01 inHg deviation from 29.92
- Density altitude temperature correction: approximately 118-120 feet per 1°C above standard (rough estimate)
- To find pressure altitude: set altimeter to 29.92 and read directly
- Performance charts require pressure altitude (and temperature) as inputs—never raw indicated altitude
Memory Aid
For the altimeter correction direction, remember: "Low pressure, look higher." When the altimeter setting is lower than 29.92, pressure altitude is higher than field elevation—you add the correction. This also ties into the classic weather-related saying "High to low, look out below" (used for altimeter errors in changing pressure environments): when flying from an area of higher pressure into an area of lower pressure without updating the altimeter, the altimeter continues to read the old, higher setting relative to the new pressure, so it reads higher than your true altitude—meaning your actual altitude is lower than what the instrument shows. For pressure altitude calculations, the same logic inverts: low altimeter setting → higher pressure altitude → worse performance.
Common Test Traps
- Confusing indicated and pressure altitude. FAA test questions will give you a field elevation and an altimeter setting, then ask you to find pressure altitude for chart entry. Students who use field elevation directly—without applying the 29.92 correction—get the wrong answer and the wrong performance figures.
- Forgetting temperature correction. Pressure altitude alone does not account for non-standard temperature. A question may describe a hot day and ask which performance value is correct; the answer requires density altitude, not just pressure altitude.
- Assuming performance improves on hot days. Some students think warmer air is somehow better. In fact, heat reduces density, which always degrades engine power, propeller efficiency, and lift. Hot + high = worst possible performance scenario.
- Direction of correction confusion. When the altimeter setting is above 29.92, pressure altitude is lower than field elevation (subtract the correction). Many students instinctively add when they should subtract, or vice versa. Use the 29.92 method—physically set the altimeter—to avoid arithmetic direction errors.
- Applying density altitude charts to the wrong input. Some density altitude charts ask for pressure altitude and temperature; others ask for field elevation and altimeter setting, then compute pressure altitude internally. Using field elevation where pressure altitude is required throws off the entire calculation. Always read chart axis labels carefully.
Mastering the relationship between indicated altitude, pressure altitude, and density altitude is not just a test requirement—it is a fundamental safety discipline. Every time you plan a departure from an unfamiliar airport, especially one at higher elevation or on a warm day, these calculations can be the difference between a normal climb and a harrowing struggle to clear terrain. Treat performance charts with the same seriousness you would a fuel calculation: the numbers exist because real pilots in real accidents discovered the hard way that assumptions about sea-level performance do not survive the climb to altitude on a summer afternoon.