One of the most dangerous and deceptive weather hazards in aviation is structural icing — the accumulation of ice on an aircraft's surfaces while in flight. Unlike turbulence or thunderstorms that a pilot can often see or feel building, icing can begin quietly and escalate rapidly. To help pilots anticipate where icing conditions exist, the FAA and the Aviation Weather Center (AWC) publish a suite of specialized forecast products centered on the freezing level and airframe icing probability. Understanding how to read and apply these products is essential for the FAA Private Pilot knowledge test and, more importantly, for surviving flight in a challenging environment.
The freezing level is simply the altitude at which the ambient air temperature drops to 0°C (32°F). Below that altitude the air is above freezing; above it the air is at or below freezing. While the freezing level itself is not automatically an icing hazard — you need both freezing temperatures and visible moisture — it defines the critical zone where icing becomes possible. These products tell you where that zone is and how severe the hazard may be.
The Freezing Level Chart
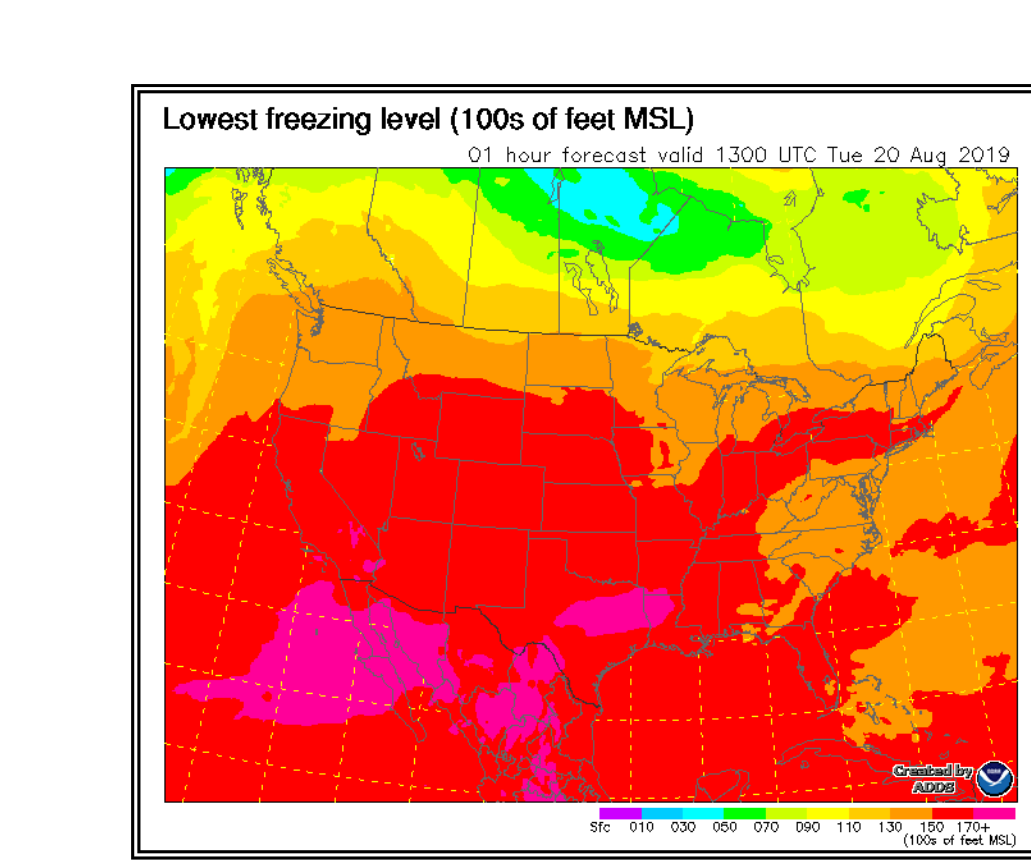
The Freezing Level Chart (also called the Freezing Level Graphic) is an analysis and forecast product generated from model data. It depicts the lowest altitude, in hundreds of feet MSL (mean sea level), at which 0°C temperature is forecast to exist at a given location. The chart covers the contiguous United States and surrounding areas and is available for multiple forecast projections — typically out to 12, 18, and 24 hours, with some products extending further.
On the chart, contour lines connect points of equal freezing level altitude, similar to topographic contour lines on a sectional. Labels indicate altitude in feet MSL. Where multiple freezing levels exist — for example, when a warm layer is sandwiched between two cold layers (a phenomenon called a temperature inversion) — the chart shows the lowest 0°C isotherm. The existence of a warm layer above a cold one is particularly dangerous because it can produce freezing rain: precipitation that forms as snow in a cold upper layer, partially melts passing through the warm layer, then refreezes on contact with an aircraft that is below the warm layer but still at a surface temperature at or below 0°C.
On the ground, if the freezing level is at or below the surface elevation, the notation SFC (surface) appears, indicating freezing temperatures exist at ground level at that location. This is critical information for departing or arriving aircraft operating in mountainous terrain.
Icing Forecast Products: The CIP and FIP
Beyond the basic freezing level chart, the FAA's Aviation Weather Center provides two sophisticated icing forecast tools that form the backbone of pre-flight icing assessment.
Current Icing Product (CIP)
The Current Icing Product (CIP) is an hourly, three-dimensional analysis of icing probability and severity across the National Airspace System. Rather than being a pure forecast, it blends numerical weather model output with real-time observations — METARs, PIREPs (pilot reports), satellite data, and radar — to produce a picture of icing conditions right now. The CIP provides:
- Icing probability — expressed as a percentage likelihood of encountering icing at a given altitude and location.
- Icing severity — categorized as trace, light, moderate, or heavy, reflecting how rapidly ice might accumulate on an airframe.
- Supercooled Large Droplet (SLD) icing — a special flag indicating the presence of freezing drizzle or freezing rain, which poses a dramatically higher threat than ordinary icing because SLD can overwhelm certified aircraft ice protection systems and impinge on areas not designed for ice accumulation.
CIP imagery is displayed as horizontal slices at selected pressure altitudes (such as 2,000 ft, 4,000 ft, 6,000 ft, etc.) or as vertical cross-sections along a user-defined route — a powerful tool for visualizing how the icing threat changes with altitude along your planned track.
Forecast Icing Product (FIP)
The Forecast Icing Product (FIP) uses the same three-dimensional approach as the CIP but projects conditions into the future — available in one-hour increments out to 18 hours. This is the planning tool used during pre-flight briefing. Like the CIP, the FIP provides probability, severity, and SLD flags at multiple altitude slices. When you see a FIP output showing 70% icing probability at moderate severity between 6,000 and 10,000 ft MSL along your route two hours from now, that is an authoritative reason to reconsider departure altitude, route, or the flight itself.
Both the CIP and FIP are accessible through the Aviation Weather Center website (aviationweather.gov), through standard weather briefing services, and through most modern electronic flight bag (EFB) applications.
PIREPs: The Human Element
No automated product replaces the value of PIREPs (Pilot Weather Reports) for icing. When a pilot encounters icing, they report the location, altitude, type of aircraft, intensity of icing, and outside air temperature. These reports are then fed back into the CIP to improve its accuracy. As a student pilot and future Private Pilot, you should know that filing PIREPs when you encounter icing — or confirm its absence — is both a professional responsibility and a service to other pilots. Negative PIREPs (confirming no icing where it was forecast) are just as valuable as positive ones.
Why It Matters: Airframe Icing and the Non-Equipped Aircraft
Most light general aviation aircraft have no FAA-certified ice protection equipment. These aircraft are prohibited from flight into known icing conditions under 14 CFR Part 91. A critical nuance here: forecast icing is not the same as known icing. An icing forecast tells you conditions are favorable for ice accumulation; known icing means a pilot has actually reported or observed icing, or the conditions are such that icing is certain (e.g., you are in visible moisture and the OAT is at or below 0°C). The practical advice from the FAA is conservative and clear: if icing is forecast along your route and your aircraft is not equipped, find an alternate route, a different altitude, or postpone the flight.
The consequences of ignoring icing forecasts are severe. Even a thin layer of ice on a wing can reduce lift by up to 30% and increase drag significantly. Ice accumulation on the propeller disrupts thrust and can cause dangerous asymmetric shedding. Carburetor ice (a separate phenomenon occurring at temperatures well above freezing in the right humidity conditions) can silently choke fuel-air mixture. The Aviation Weather Handbook (FAA-H-8083-28) explains that rime ice — the rough, opaque type — accumulates on leading edges and disrupts airflow over the wing, while clear ice — the heavier, transparent type formed from large supercooled droplets — can flow back beyond deiced surfaces and is harder to shed even with anti-icing equipment.
Key Numbers and Rules
- 0°C (32°F) — the freezing level temperature; the boundary below which liquid water remains unfrozen in the atmosphere.
- Icing intensity categories — Trace, Light, Moderate, and Severe (also called Heavy in some contexts); Moderate and Severe icing require immediate pilot action.
- SLD conditions — freezing drizzle droplets greater than 50 micrometers; certified deicing equipment may be overwhelmed; non-equipped aircraft must avoid entirely.
- CIP update cycle — hourly; FIP valid out to 18 hours in one-hour increments.
- PIREP icing codes — trace (TR), light (LGT), moderate (MDT), severe (SEV); always accompanied by aircraft type because ice accumulation rate depends on aircraft speed and surface geometry.
- Freezing level chart labels — altitudes in hundreds of feet MSL; SFC notation means freezing temperatures at ground level.
Common Test Traps
- Freezing level ≠ guaranteed icing. The FAA exam often tests whether students know that the freezing level is a necessary but not sufficient condition for structural icing. You also need visible moisture (clouds, precipitation, fog with visibility under one mile). Clear, cold air above the freezing level poses no structural icing risk.
- Forecast icing vs. known icing. Many students confuse these terms. A forecast of icing does not legally constitute known icing conditions, though prudence demands you treat a credible forecast as a serious hazard if your aircraft is not equipped.
- Temperature inversion and freezing rain. Exam questions test whether you recognize that a warm layer aloft producing freezing rain creates an especially severe icing hazard below the warm layer — often more dangerous than ordinary icing in clouds because the large droplets freeze on contact with supercooled surfaces.
- CIP vs. FIP. Know the difference: CIP is a current analysis (nowcast) using real observations blended with model data; FIP is a pure forecast product. On the test, questions about what is happening right now point to CIP; questions about planning a flight hours from now point to FIP.
- SFC notation on the freezing level chart. Students sometimes overlook that SFC means the freezing level is at or below the terrain surface, implying freezing conditions from the ground up — a critical departure planning consideration in mountainous or cold regions.
By developing fluency with the freezing level chart, CIP, and FIP before each flight, a Private Pilot can make well-informed altitude and route decisions that keep icing well outside the cockpit. These tools are not just test material — they are genuine life-safety resources that reflect the best available atmospheric science applied directly to the airman's go/no-go decision.