Structural icing is one of the most insidious threats an IFR pilot faces. Unlike turbulence, which announces itself violently, ice can accumulate quietly on wings, propellers, and antennas before the pilot realizes anything is wrong. Understanding how to extract icing information from prognostic (prog) charts, freezing-level graphics, and related forecasts is not just an exam skill — it is a genuine survival skill for instrument-rated pilots operating in IMC during cold seasons.
This article walks through every layer of the icing forecast system: where the freezing level sits and why it moves, how forecasters communicate that information graphically, and how you integrate multiple products into a coherent go/no-go decision. All information is grounded in FAA guidance and the Aviation Weather Handbook (FAA-H-8083-28).
The Freezing Level: What It Is and Why It Moves
The freezing level (also called the 0 °C isotherm) is the altitude at which the ambient air temperature equals 0 degrees Celsius on the standard lapse rate curve. Below this altitude the air is above freezing; above it, the air is at or below freezing. In practice, multiple freezing levels can exist in a single air mass — for example, a warm layer sandwiched between cold layers can produce a melting layer aloft, creating a zone where precipitation transitions from snow to rain and back again. This multi-layer scenario is especially dangerous because it can produce large, supercooled liquid water droplets.
The freezing level is not fixed. It rises during the day as solar heating warms the lower atmosphere, and it drops at night. It varies with latitude, season, and synoptic weather patterns. Over the continental United States, a typical summer freezing level might sit at 10,000–14,000 feet MSL, while in winter it may descend to the surface over large portions of the northern and mountain states. Pilots operating in mountainous terrain face a compounding hazard: the terrain itself may be near or above the freezing level, leaving little room between the ground and the ice.
Icing Threat Mechanics: Why the Freezing Level Is Just the Starting Point
Knowing where the freezing level sits tells you where ice could form, but actual structural icing requires two additional ingredients: visible moisture (clouds, freezing rain, freezing drizzle) and an aircraft surface temperature at or below 0 °C. An aircraft flying above the freezing level in clear air will not accumulate ice even though the air is below freezing, because there is no liquid water to freeze on contact. Conversely, the most severe icing often occurs just above the freezing level, where supercooled large droplets (SLDs) — still liquid despite temperatures as cold as −20 °C or lower — collide with the airframe and freeze instantly.
The zone of greatest concern typically extends from the freezing level up to about −20 °C, though icing can occasionally occur at colder temperatures where SLDs exist. Above −40 °C, all water droplets freeze spontaneously and icing effectively ceases, which is why high-altitude cruise flight is generally ice-free despite very cold temperatures.
Forecast Products: The Prog Chart Family
Low-Level Significant Weather Prog Chart
The Low-Level Significant Weather Prognostic Chart covers the surface up to FL240 (24,000 feet MSL) and is issued four times daily by the Weather Prediction Center. It comes in two panels: a 12-hour and a 24-hour forecast. Icing is depicted using a dashed contour that outlines areas of forecast moderate or greater icing. Inside the contour, a bracketed altitude range (e.g., [6–14]) shows the base and top of the icing layer in hundreds of feet MSL, meaning 6,000 to 14,000 feet MSL. A small zigzag symbol inside the contour confirms the icing hazard type. Pilots must remember that the prog chart shows only moderate or greater icing — trace icing may exist outside the contoured areas, particularly in any area with visible moisture below the freezing level.
High-Level Significant Weather Prog Chart
The High-Level Significant Weather Prog Chart covers FL250 and above, primarily for turbine and high-altitude operations. At these altitudes, temperatures are typically too cold for significant liquid-water icing, so the high-level prog focuses on turbulence, jet streams, and tropopause heights rather than structural icing. Instrument pilots flying below FL250 should focus almost exclusively on the low-level prog for icing information.
Freezing Level Graphics (Graphical Freezing Level Forecast)
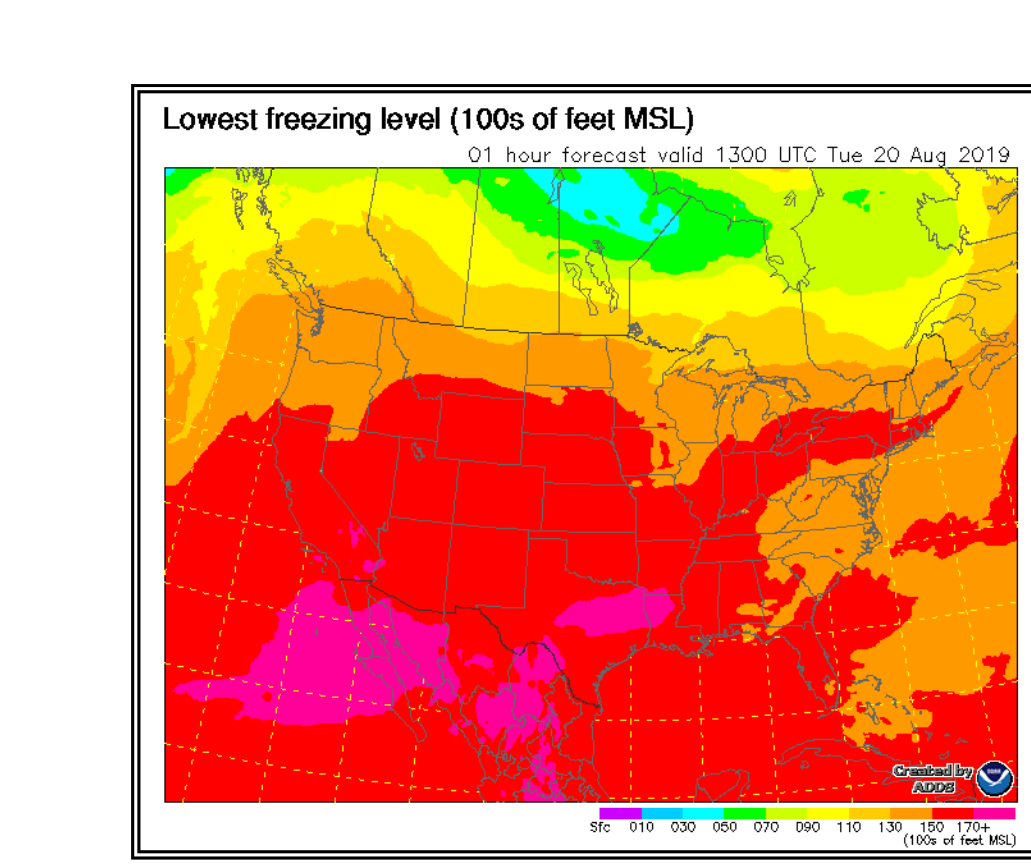
The Aviation Weather Center (AWC) produces Freezing Level Graphics — color-coded maps showing the MSL altitude of the lowest freezing level across the contiguous United States. These are updated frequently and are available on the AWC website. The color scale ranges from green (low freezing level, near the surface) through yellow and orange to red (high freezing level, well above terrain). A pink or purple shading near the surface indicates the freezing level is at or below the surface — meaning any precipitation in that area is likely freezing rain, freezing drizzle, or snow. These surface-level freezing conditions are particularly dangerous for taxi and takeoff operations.
Because these graphics show only the lowest freezing level, pilots must also check for multiple freezing layers. A separate product, the Icing Forecast (CIP/FIP) — the Current Icing Product and Forecast Icing Product — provides a three-dimensional view of icing probability and severity at multiple flight levels, updated hourly. The FIP is arguably the most operationally useful product for IFR flight planning.
AIRMETs and SIGMETs: The Regulatory Layer
While prog charts and freezing-level graphics are planning tools, AIRMETs Sierra and Zulu carry regulatory significance for instrument pilots. AIRMET Zulu is issued specifically for moderate icing and includes the freezing level in the advisory text. It is valid for up to six hours and covers areas where moderate icing is forecast to affect aircraft below FL180. SIGMET advisories are issued for severe icing — a condition that can overcome most aircraft ice-protection systems — and they demand immediate attention regardless of a pilot's experience level.
Pilots should cross-check the AIRMET/SIGMET text with the prog chart depiction. Sometimes a prog chart boundary and an AIRMET boundary will not match perfectly because they are produced by different offices on different update cycles. The AIRMET is generally more current and should be treated as the authoritative advisory for the forecast period.
Key Numbers and Rules
- 0 °C isotherm = freezing level; the base of the icing threat zone when visible moisture is present.
- −20 °C = approximate upper limit of most significant structural icing; SLDs may exist to colder temperatures.
- −40 °C = homogeneous nucleation point; all droplets freeze spontaneously, icing essentially ceases.
- Low-level prog covers surface to FL240; moderate or greater icing shown with dashed contours and bracketed altitudes in hundreds of feet MSL.
- AIRMET Zulu = moderate icing, valid up to 6 hours, below FL180.
- SIGMET for severe icing = non-convective SIGMET, extremely hazardous.
- Freezing level at surface = expect freezing rain/drizzle on the ground; a critical takeoff and climb consideration.
- CIP/FIP products update hourly and show icing probability and severity at each flight level — invaluable for in-flight decisions via ADS-B weather or datalink.
Practical In-Cockpit Strategy
For IFR flight planning in potential icing conditions, build your weather picture in layers. Start with the freezing-level graphic to establish where 0 °C sits along your route. Then check the low-level prog chart to see if moderate or greater icing is forecast along your proposed altitude. Cross-check with the FIP for a probability and severity estimate at your planned cruise altitude and at alternative altitudes. Finally, read all current AIRMETs and SIGMETs for your route. If icing is forecast along your entire viable altitude range and your aircraft is not certified for flight into known icing (FIKI), the decision is straightforward: do not go.
If your aircraft does have ice-protection equipment, remember that FIKI certification means the aircraft can survive a brief encounter with known icing conditions — it does not mean the aircraft is immune. Severe icing, freezing rain, and SLD environments can overwhelm any protection system. The FAA's guidance in FAA-H-8083-28 is explicit: pilots should exit icing conditions as quickly as possible regardless of equipment certification.
Common Test Traps
- Confusing trace and moderate icing on prog charts. The prog chart only contours moderate or greater icing. Trace icing outside the contour is not shown but may still be present wherever there is visible moisture below the freezing level.
- Assuming the freezing level is a single, fixed altitude. Multiple freezing levels can exist in one vertical column, creating alternating icing and non-icing layers — a scenario the FIP captures but a simple freezing-level graphic may not fully convey.
- Misreading bracketed altitude values. On the prog chart, bracketed icing altitudes are always expressed in hundreds of feet MSL. [6–14] means 6,000 to 14,000 feet MSL — always read the numbers as hundreds of feet, not tens or units.
- Treating AIRMET Zulu as the only icing warning. Severe icing appears on a SIGMET, not an AIRMET. If conditions are forecast severe, an AIRMET will NOT be issued — the SIGMET replaces it.
- Overlooking the surface-level freezing threat for departure and arrival. A freezing level at or below the surface on the freezing-level graphic signals freezing precipitation, which affects ground operations, takeoff performance, and the climb phase just as critically as cruise-altitude icing.