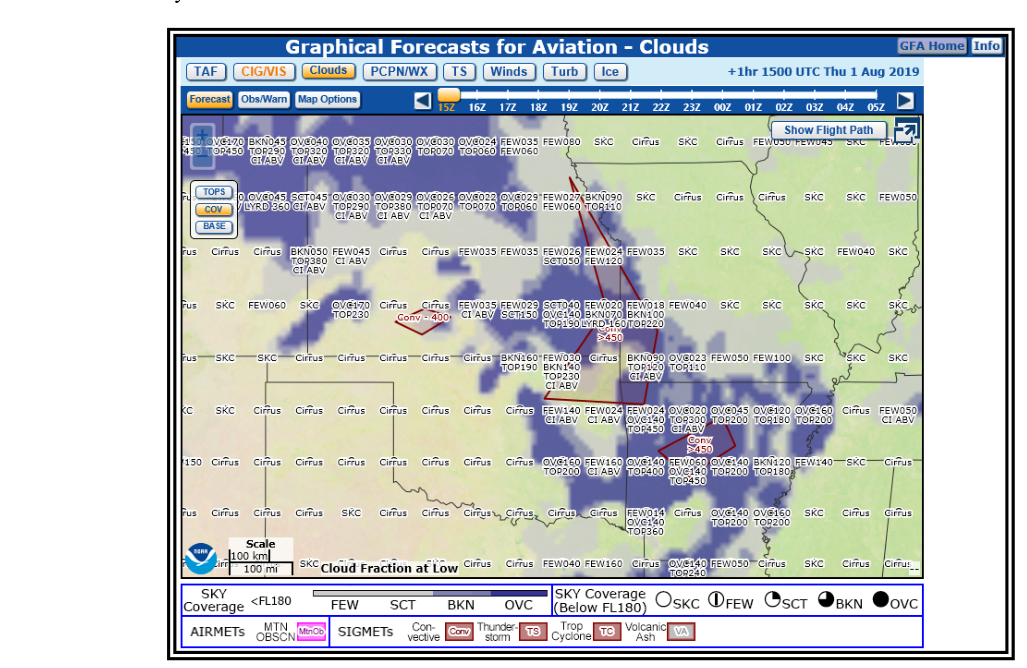
When the FAA and National Weather Service (NWS) retired the legacy textual Area Forecasts (FA) for the contiguous United States in 2017, pilots needed a new way to access the same critical en-route weather information. The answer was the Graphical Forecasts for Aviation (GFA) tool, an interactive, web-based platform available through aviationweather.gov. Rather than decoding dense text abbreviations buried in a multi-paragraph forecast, pilots can now view weather layers on a geographic map, toggle between forecast times, and overlay hazard information directly onto their planned route. For IFR pilots, understanding how to extract actionable information from the GFA is both an exam requirement and a genuine cockpit safety skill.
The GFA covers the contiguous 48 states (CONUS), plus adjacent coastal waters and the Great Lakes region. It does not replace forecast products for Alaska or Hawaii, which continue to use separate area forecast products. The tool is designed for pre-flight planning, presenting forecast data out to 18 hours — hourly increments through 15 hours, then 3-hour increments from 15 to 18 hours — for most weather elements, with some elements extending further depending on the data source. Always verify the valid time displayed on the GFA product before drawing any conclusions about the weather you will encounter.
How the GFA Tool Works
The GFA is not a single forecast — it is a layered visualization platform that pulls together multiple forecast products and model output and presents them on a common map interface. You access it at aviationweather.gov and select the GFA tab. Along the top of the tool, you choose the weather element you want to view; along the timeline slider at the bottom, you select the valid time. The main elements available include:
- Clouds: Forecast cloud coverage (sky condition), bases, and tops. Layers are color-coded by coverage — FEW, SCT, BKN, OVC — and the depicted altitude is the Mean Sea Level (MSL) height of the cloud base or top. Hovering or clicking a point on the map provides a text readout of the forecast values at that location.
- Flight Category: Perhaps the most operationally direct layer for IFR pilots. The map color-codes each area as VFR (green), MVFR (blue), IFR (red), or LIFR (magenta) based on the forecast ceiling and visibility at any given hour. This is derived from the Localized Aviation MOS Program (LAMP) and Model Output Statistics (MOS) and is updated frequently throughout the day.
- Precipitation: Type (rain, snow, freezing rain, ice pellets, convective) and coverage of precipitation. This layer is critical for identifying where icing encounters might occur due to freezing rain aloft or at the surface.
- Thunderstorms and Convection: Shows areas of forecast convective activity, including the probability and coverage of thunderstorms. Used in conjunction with AIRMETs/SIGMETs, this helps a pilot identify strategic routing around convective hazards.
- Icing: Probability and severity of in-flight icing at various altitudes. The icing layer uses the Forecast Icing Product (FIP), which provides probability of icing, icing severity, and the presence of supercooled large drops (SLD). SLD is particularly hazardous because current aircraft deicing and anti-icing systems may not provide adequate protection in SLD conditions.
- Turbulence: Forecast turbulence severity (light, moderate, severe) and the altitude range of the hazard. The turbulence layer draws from both the Graphical Turbulence Guidance (GTG) product for clear-air turbulence (CAT) and mountain wave turbulence (MWT) forecasts.
- Wind and Temperature Aloft: Forecast winds and temperatures at various flight levels, which feed directly into fuel planning and altitude selection for IFR flights.
One of the most powerful features of the GFA is the ability to animate the forecast by stepping through hours on the time slider. This lets you visualize how a weather system is expected to develop, move, and dissipate along your planned route, giving you a dynamic picture rather than a single static snapshot.
Relationship to AIRMETs and SIGMETs
A common misunderstanding is that the GFA replaces AIRMETs and SIGMETs. It does not. AIRMETs (Airmen's Meteorological Information) and SIGMETs (Significant Meteorological Information) remain active, legally significant weather advisories issued by the Aviation Weather Center (AWC). The GFA incorporates AIRMET and SIGMET boundaries as an overlay layer, meaning you can see where Sierra (IFR conditions/mountain obscuration), Tango (turbulence, strong surface winds, low-level wind shear), and Zulu (icing and freezing levels) AIRMETs are in effect alongside the underlying forecast data. This integration helps pilots understand both the presence of a hazard (via the advisory boundary) and the magnitude and distribution of that hazard (via the FIP or GTG data beneath).
For flight planning purposes, SIGMETs represent the most urgent hazards — severe or extreme turbulence, severe icing, volcanic ash, and tropical cyclone activity — and always take priority in your preflight weather evaluation. Because SIGMETs are updated as conditions evolve, pilots should check for new SIGMETs not only during preflight but also via ATIS, HIWAS (where available), FSS, or controller advisories once airborne.
Why the GFA Matters for IFR Pilots
IFR flight by definition places pilots in or near instrument meteorological conditions (IMC), where the consequences of encountering unexpected icing, turbulence, or embedded convection can be catastrophic. The GFA provides a pre-flight tool to identify these hazards before departure, enabling better route planning, altitude selection, and go/no-go decision-making. Specifically, the GFA helps IFR pilots:
- Select the optimal cruise altitude — by reviewing icing probability layers at multiple flight levels, you can choose an altitude likely to be above or below the icing layer, or identify a layer-free window entirely.
- Anticipate IMC onset and duration — the flight category animation can reveal whether the destination airport is forecast to be IFR only during your arrival window, allowing you to brief alternates effectively.
- Identify SLD threats early — the icing product's SLD indicator is invaluable for aircraft without SLD-approved ice protection systems, as pilots should deviate away from known or forecast SLD areas.
- Plan for fuel and alternates — seeing a widespread IFR or LIFR area across the destination region signals the need for a carefully chosen alternate with better forecast conditions.
Key Numbers and Rules
- GFA coverage: Contiguous 48 states (CONUS) and adjacent coastal and Great Lakes waters.
- Forecast horizon: Up to 18 hours total — hourly increments through 15 hours, then 3-hour increments from 15 to 18 hours, for most elements; some icing and turbulence products extend further.
- Flight categories by ceiling and visibility: VFR = ceiling >3,000 ft AGL and visibility >5 SM; MVFR = ceiling 1,000–3,000 ft AGL and/or visibility 3–5 SM; IFR = ceiling 500–999 ft AGL and/or visibility 1–3 SM; LIFR = ceiling <500 ft AGL and/or visibility <1 SM.
- AIRMET Zulu addresses moderate icing and freezing levels; AIRMET Sierra addresses IFR conditions and mountain obscuration; AIRMET Tango addresses moderate turbulence, sustained surface winds >30 kt, and low-level wind shear.
- SIGMETs cover severe or extreme turbulence, severe icing (not associated with thunderstorms), dust storms/sandstorms lowering visibility below 3 SM, and volcanic ash. Convective SIGMETs are issued for severe thunderstorms with surface winds >50 kt, hail >3/4 inch diameter, or tornadoes, and for embedded thunderstorms, lines of thunderstorms, and areas of thunderstorms covering at least 40% of an area of 3,000 sq mi or more.
- Update frequency: The GFA flight category layer updates approximately hourly as new MOS and LAMP data become available.
Common Test Traps
- GFA replaces the Area Forecast text product for CONUS, not AIRMETs or SIGMETs. Many students assume the GFA replaced all legacy products. AIRMETs and SIGMETs remain mandatory preflight weather briefing items and are overlaid on — not eliminated by — the GFA.
- Flight category ceilings are AGL, but cloud heights on the GFA are depicted in MSL. When interpreting the Clouds layer versus the Flight Category layer, be careful about which altitude reference is being used. This distinction matters significantly in mountainous terrain.
- The GFA is a forecast tool, not a real-time observation. It does not replace METARs, PIREPs, or real-time radar. Always cross-check GFA forecasts against current observations before departure and en route.
- SLD icing requires immediate action regardless of aircraft certification. Even if an aircraft is certificated for flight into known icing (FIKI), SLD conditions may exceed the design limits of the ice protection system. The FAA and aircraft manufacturers advise exiting SLD conditions immediately by changing altitude or route.
- Do not confuse AIRMET valid times with SIGMET valid times. AIRMETs (Sierra, Tango, and Zulu, including icing) are each valid for up to 6 hours, with amendments issued as conditions change; SIGMETs are valid for up to 4 hours in most cases (up to 6 hours for tropical cyclones and volcanic ash). Convective SIGMETs are valid for up to 2 hours.
Mastering the GFA tool is more than a knowledge test checkbox — it is a foundational preflight habit for every IFR pilot. By spending a few minutes stepping through forecast hours, toggling between the icing, turbulence, and flight category layers, and cross-referencing active AIRMETs and SIGMETs, you develop a three-dimensional mental model of the weather environment your flight will enter. That situational awareness, built on the ground before engine start, is one of the most powerful risk-mitigation tools available to an instrument-rated pilot.