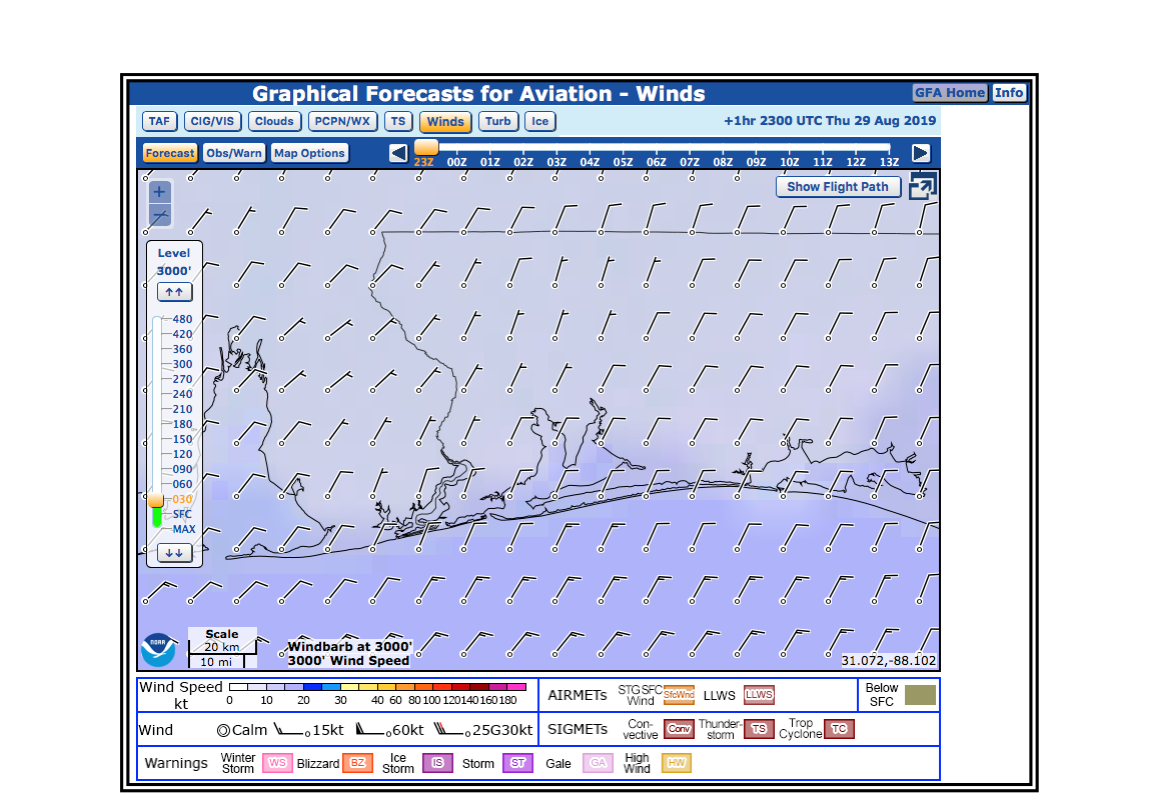
When the FAA retired the printed Area Forecast (FA) as a primary planning tool for lower-altitude operations, it introduced the Graphical Forecasts for Aviation (GFA) — an interactive, web-based tool hosted at aviationweather.gov. For Part 107 remote pilots, the GFA is not just a convenience; it is one of the most practical weather resources available for assessing conditions across a broad geographic area before and during UAS operations. Understanding how to read and use the GFA is both an FAA knowledge test topic and a genuine safety habit that protects your equipment, your certificate, and the people below your aircraft.
Unlike a single-station TAF, the GFA paints weather across the contiguous United States (CONUS) in a map-based, layered format. You can zoom into your planned operating area, select the forecast time that matches your flight window, and evaluate multiple weather elements simultaneously. This article walks through how the tool works, what it displays, why it matters for sUAS operations specifically, and what the FAA expects you to know for the Part 107 Aeronautical Knowledge Test.
What the GFA Tool Displays
The GFA is built on a mosaic of gridded forecast data produced by the National Weather Service (NWS). It synthesizes model output, PIREPs, METARs, and forecaster interpretation into a single interactive interface. Remote pilots should become comfortable navigating its major weather layers:
- Clouds: Depicts cloud coverage (sky condition), cloud base heights, and tops in AGL (above ground level) and MSL values. You can see where ceilings are expected to drop — critical because Part 107 requires visual line-of-sight and the ability to detect and avoid other aircraft.
- Precipitation: Shows type (rain, snow, freezing precipitation) and intensity. Precipitation affects camera sensors, reduces visibility, and can compromise your aircraft's structural integrity.
- Visibility: Displays surface visibility in miles across the region. Under 14 CFR Part 107, the remote pilot must maintain a minimum visibility of 3 statute miles from the control station, so this layer is directly tied to a regulatory requirement.
- Winds: Wind speed, direction, and gusts at various altitude levels. The tool provides wind data at the surface and at several altitude layers aloft — useful for sUAS operations that may reach the maximum 400-foot AGL ceiling (or up to 400 feet above a structure).
- Turbulence and Icing: Although these layers are most relevant to manned aviation at higher altitudes, they provide situational awareness about atmospheric instability that can cascade down to low-altitude UAS operations as mechanical or convective turbulence.
The GFA's Forecast tab lets the user step through forecast time periods out to 15 hours from the current time, generally in increments of one to three hours depending on the parameter being viewed. (A separate Observations tab covers the past 2 hours of actual conditions.) This temporal flexibility lets you compare conditions at your planned launch time versus a contingency window later in the day.
How to Use the GFA for UAS Mission Planning
Effective GFA use for Part 107 operations follows a systematic workflow. Before any flight, a remote pilot should treat weather evaluation as a required preflight action — not optional.
Step 1 — Identify Your Operating Area
Zoom the GFA map to your specific operating site or, for larger survey missions, the entire corridor you plan to cover. Because the GFA is gridded, it shows spatial variation: conditions may be acceptable at one end of a linear corridor but deteriorating a few miles away. This spatial view is a major advantage over a single-point weather observation or forecast.
Step 2 — Check Visibility and Ceiling Layers
Toggle the Visibility layer and confirm the forecast visibility at your planned flight time meets the Part 107 minimum of 3 statute miles. Then switch to the Clouds layer and examine the cloud base altitude. While Part 107 does not establish a specific cloud ceiling minimum for sUAS the way instrument flight rules do for manned aircraft, visibility and the ability to maintain visual contact with your aircraft are still paramount. Low ceilings can also signal IFR conditions and the presence of manned IFR traffic operating at low altitudes, increasing collision risk.
Step 3 — Evaluate Winds
Examine the Winds layer at the surface and at altitudes near your planned operating ceiling. Most small UAS have published maximum wind speed limitations in their operating handbooks — often in the range of 20 to 25 knots for consumer-grade platforms, though this varies by aircraft. The GFA wind layer lets you assess whether sustained winds or gusts may exceed your aircraft's limits. Remember that surface wind observations may underestimate winds even at 200–400 feet AGL due to terrain shielding at ground level.
Step 4 — Look for Precipitation and Convective Activity
Check the Precipitation layer for any forecast rain, drizzle, or — in winter operations — freezing precipitation. Most small UAS are not rated for flight in precipitation. Beyond equipment damage, wet surfaces can create slippery launch and recovery zones, and falling rain reduces the effective visibility further. The GFA Clouds layer will also reveal convective cloud development (towering cumulus, cumulonimbus) that signals potential thunderstorm activity. Thunderstorms bring severe turbulence, lightning, heavy precipitation, and rapidly shifting winds — all of which are incompatible with safe sUAS operations.
Step 5 — Cross-Check with METARs and TAFs
The GFA is a forecast tool and carries inherent uncertainty. Before flight, always cross-reference GFA forecasts with the most recent METAR (actual observed weather) from the nearest reporting station. For planned operations starting more than an hour in the future, a current TAF from a nearby airport provides another data point. The Aviation Weather Center's website integrates METARs directly into the same interface, making this comparison straightforward.
Why the GFA Matters for Part 107 Remote Pilots
Part 107 places the responsibility for weather evaluation squarely on the remote pilot in command (RPIC). Under 14 CFR §107.49, the RPIC must, prior to flight, assess the operating environment — which expressly includes weather conditions. Ignorance of available forecasts is not a legal defense if an accident occurs due to adverse weather. The GFA is one of the most accessible and comprehensive tools the FAA and NWS make freely available, so failing to consult it is difficult to justify.
Beyond regulatory compliance, weather affects sUAS operations in concrete ways. Wind is the most common weather-related cause of sUAS incidents — strong or gusty winds can overpower the flight controller's ability to maintain position, lead to fly-aways, or cause the aircraft to drift into restricted airspace or obstacles. Reduced visibility makes it harder to maintain visual line-of-sight (VLOS) and to see-and-avoid manned traffic. Precipitation can short-circuit electronics, fog camera lenses, and degrade propeller performance. Temperature extremes affect battery capacity significantly — cold temperatures in particular reduce lithium-polymer battery discharge capacity, shortening flight time unexpectedly.
Key Numbers and Rules
- 3 statute miles: Minimum flight visibility required under Part 107 (14 CFR §107.51).
- 400 feet AGL: Maximum altitude for standard Part 107 operations (or 400 feet above a structure within a 400-foot radius of it).
- 15 hours: Approximate forecast range of GFA Forecast-tab products from the current time.
- 1–3 hour increments: Typical time steps available in the GFA Forecast tab, depending on the parameter.
- CONUS coverage: The GFA covers the contiguous 48 states; Alaska and Hawaii have separate NWS products.
- No specific minimum ceiling under Part 107 — but visual line-of-sight with the sUAS must be maintained at all times, making low ceilings a practical hazard even without an explicit ceiling number in the rule.
Common Test Traps
- Confusing GFA with TAFs: The GFA is a graphical, area-wide forecast product; a TAF is a text-based, single-airport forecast. They serve related but different purposes. The GFA covers the whole region while a TAF applies only within roughly 5 statute miles of the reporting airport.
- Ignoring the time step feature: Students sometimes treat the GFA as a snapshot of current conditions, missing the fact that it is a forecast tool with selectable time windows. Always set it to your planned flight time, not just the default current time.
- Assuming 3-mile visibility means the ceiling is acceptable: Part 107 requires 3 SM visibility but does not specify a ceiling minimum by number. A 200-foot overcast can satisfy the 3 SM visibility rule on paper but prevent safe VLOS operations. Always evaluate ceiling and visibility together.
- Underestimating wind aloft versus surface wind: Surface wind at a sheltered urban site may read calm while winds at 300–400 feet AGL are strong enough to exceed your aircraft's operating limits. Use the GFA wind altitude layers, not just the surface reading.
- Treating the GFA as a sole source: The FAA expects pilots to cross-check forecasts against current observed data (METARs). Relying solely on GFA without checking actual conditions at nearby stations is an incomplete preflight weather briefing.