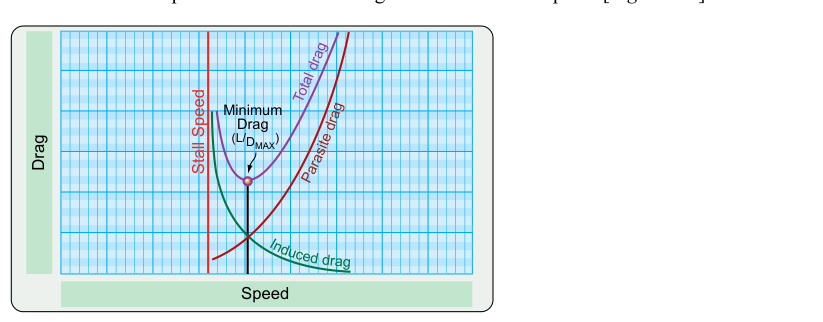
Every airplane in flight simultaneously battles two fundamentally different categories of aerodynamic drag. These forces behave in opposite ways as airspeed changes, and their interaction produces the characteristic U-shaped total drag curve that underlies virtually every performance decision a commercial pilot makes — from selecting best-glide speed after an engine failure to optimizing cruise altitude for fuel economy. Mastering the physics, the numbers, and the operational implications of induced drag and parasite drag is therefore not merely an exam requirement; it is a cornerstone of professional airmanship.
Induced Drag: The Price of Lift
Induced drag is an inescapable consequence of lift production. When a finite wing generates lift, a pressure differential exists between the lower surface (relatively high pressure) and the upper surface (relatively low pressure). At each wingtip, air from the high-pressure region beneath the wing escapes upward and outward around the tip toward the low-pressure region above, rolling into rotating columns of air called wingtip vortices. These vortices persist behind the aircraft and represent a significant hazard to following traffic — the basis of the FAA wake turbulence separation standards described in the AIM.
More immediately, those vortices alter the local airflow experienced by the wing itself. The rotating air behind the wing introduces a downward component to the local relative wind, a phenomenon called downwash. From the wing's perspective, downwash effectively tilts the resultant lift vector slightly aft of the geometric vertical. That rearward-tilted component of lift is induced drag. Because the wing is, in a sense, dragging against its own wake, pilots sometimes think of induced drag as the aerodynamic cost the airplane pays for making lift.
The critical speed relationship: induced drag varies inversely with the square of airspeed. At low airspeeds, the wing must fly at a high angle of attack to produce sufficient lift, generating stronger vortices and therefore more downwash and more induced drag. Double the airspeed and induced drag falls to one-quarter of its former value. This inverse-square relationship means the induced drag curve is a hyperbola that descends steeply from the left (slow) side of a speed graph toward the right.
Weight amplifies induced drag significantly. A heavier aircraft requires more lift at any given airspeed, forcing a higher angle of attack and stronger vortices. This is why the speed for maximum lift-to-drag ratio — and the published best-glide speed — increases with gross weight. If the aircraft is loaded near maximum gross weight, relying on a best-glide speed memorized for a lighter loading can cost precious altitude in an engine-out scenario.
Parasite Drag: Everything Else
Parasite drag is the umbrella term for all drag that is independent of lift production. It has three primary components, each described in the Pilot's Handbook of Aeronautical Knowledge (PHAK, FAA-H-8083-25):
- Form drag results from the pressure differential created by the shape of the aircraft moving through the air. A blunt, flat-faced object creates a large low-pressure wake behind it; a streamlined shape minimizes that wake. Retractable landing gear, wing fillets, and fairings are all engineering responses to form drag.
- Skin friction drag arises from the boundary layer of air that clings to every surface of the aircraft. Even a perfectly smooth surface still produces skin friction. Surface roughness — frost, bugs, ice — thickens the boundary layer and substantially increases skin friction drag, which is why even a thin layer of frost on the wing is prohibited for takeoff under 14 CFR.
- Interference drag is generated at junctions between airframe components — where the wing meets the fuselage, where external fuel tanks attach, or where antenna bases protrude. Flow from one component disrupts the flow around another, creating additional turbulence and drag beyond the sum of the individual components' drag values.
Parasite drag behaves in the opposite manner from induced drag: it varies as the square of airspeed. Double your airspeed and parasite drag quadruples. At typical cruise speeds, parasite drag dominates the drag budget by a wide margin, which is why aerodynamic cleanliness — retracted gear, closed cowl flaps, fairings in good repair — has such a pronounced effect on cruise performance and fuel consumption.
The Total Drag Curve and L/DMAX
When you plot both drag components on the same graph with airspeed on the horizontal axis and drag force on the vertical axis, induced drag traces a descending hyperbola from left to right while parasite drag traces an ascending parabola. Their arithmetic sum at every point on the speed scale produces the total drag curve — a smooth, U-shaped curve with a distinct minimum. That minimum point is called L/DMAX, the speed of maximum lift-to-drag ratio, and it occurs precisely where induced drag and parasite drag are numerically equal to each other.
L/DMAX is arguably the single most operationally significant point on any aircraft's drag curve. Consider what the ratio L/D represents: for every pound of drag the aircraft produces, the wing is generating a corresponding number of pounds of lift. Maximizing that ratio means the wing is producing the greatest amount of lift for the least aerodynamic penalty — the most aerodynamically efficient condition the aircraft can achieve.
Operational Significance by Aircraft Category
Piston-Propeller Aircraft
Best glide speed corresponds to L/DMAX. At this speed, the aircraft travels the maximum horizontal distance for each foot of altitude surrendered — critical during an engine-out emergency. Pilots are taught to establish best-glide speed immediately after an engine failure precisely because any deviation in either direction places the aircraft on the steeper sides of the U, increasing drag and reducing glide distance.
Best range for a piston-propeller airplane is achieved at or very near L/DMAX. Because the engine must produce thrust equal to total drag to maintain level flight, flying at minimum drag means minimum thrust required and, for a given throttle setting, minimum fuel flow per nautical mile.
Best endurance (maximum time aloft) for a piston-prop occurs at the minimum power required speed, which is slightly slower than L/DMAX — on the left, induced-drag-dominant side of the curve. Power required equals drag multiplied by velocity, and the minimum of that product falls at a speed somewhat below the minimum-drag speed. Flying slower than L/DMAX costs range but can maximize loiter time.
Turbojet and Turbofan Aircraft
Jet engines produce thrust, and fuel flow is approximately proportional to thrust rather than power. Because of this, maximum endurance for a jet occurs at L/DMAX (minimum thrust = minimum drag = minimum fuel flow). Best range for a jet, however, occurs at a speed slightly above L/DMAX, where the product of airspeed and L/D is maximized. This distinction is frequently tested on the Commercial Pilot knowledge test.
Key Numbers and Rules
- Induced drag ∝ 1/V² — halve the speed, induced drag quadruples.
- Parasite drag ∝ V² — double the speed, parasite drag quadruples.
- At L/DMAX: induced drag = parasite drag (they are exactly equal).
- L/DMAX speed increases with aircraft weight; best-glide IAS climbs as the airplane gets heavier.
- Frost, ice, or surface contamination on wing surfaces increases parasite drag and degrades stall characteristics — 14 CFR part 91 and part 135 regulations prohibit takeoff with those contaminants.
- Aspect ratio matters: a high-aspect-ratio wing (long, slender) produces weaker wingtip vortices per unit of lift and therefore less induced drag — the principle behind sailplane wing design.
Common Test Traps
- Reversing the speed relationships. Induced drag decreases as speed increases; parasite drag increases as speed increases. Swapping these is among the most frequent errors on the Commercial Pilot Airmen Knowledge Test.
- Treating best-range speed identically for jets and props. For a piston-prop, best range ≈ L/DMAX. For a jet, best range is slightly faster than L/DMAX. These are different points on the drag curve.
- Forgetting that minimum total drag = maximum L/D. Questions may ask for the condition producing the highest L/D ratio — the answer is flight at minimum total drag speed, which is the same as L/DMAX.
- Ignoring weight effects on L/DMAX speed. The speed at minimum drag is not fixed; it rises with increasing gross weight. A pilot using a memorized best-glide speed for a lightly loaded aircraft will be flying too slowly when the aircraft is heavily loaded, increasing drag and reducing glide range.
- Assuming parasite drag components are negligible. Even small increases in surface roughness or protruding antennas add to parasite drag. At high cruise speeds, these penalties are amplified by the square-law relationship and have a measurable effect on range and fuel consumption.
Memory Aid
Use the phrase "Induced Is Inside (lift-linked); Parasite Plays Outside (everything else)." For the speed behavior: "Slow = Induced rules; Fast = Parasite rules." The crossover — where induced and parasite are equal — is the bottom of the drag bucket, the L/DMAX sweet spot every performance calculation pivots around.