Every pilot quickly learns that drag is the enemy of efficient flight, but drag is not a single, simple force. It is the sum of two fundamentally different components — parasite drag and induced drag — that behave in exactly opposite ways as airspeed changes. Understanding how these two forces interact, and what happens when you add them together on a graph, is one of the most powerful concepts in aerodynamics. It explains why your airplane has a speed that requires the least thrust, why flying too slowly is just as inefficient as flying too fast, and why the best-glide and best-range speeds are what they are. The FAA knowledge test probes this topic regularly, so let's break it down completely.
What Is Parasite Drag?
Parasite drag is every form of drag that is not a byproduct of generating lift. It includes three subtypes. Form drag (also called pressure drag) results from the shape of the aircraft pushing air out of the way and leaving a disturbed wake behind it — a blunt, flat object creates far more form drag than a streamlined teardrop shape. Skin friction drag arises from the viscosity of air rubbing along the aircraft's surface; a rough surface with rivets and imperfections creates more friction than a smooth, polished one. Interference drag occurs where different parts of the aircraft — wings, fuselage, landing gear, antennas — meet and their individual airflows combine turbulently, producing more drag than the parts would create separately.
The defining characteristic of parasite drag is its relationship with airspeed: parasite drag varies with the square of airspeed. Double your speed, and parasite drag increases by a factor of four. Triple your speed, and it increases by nine. This exponential growth means that at high speeds, parasite drag dominates the aerodynamic picture overwhelmingly. At low speeds, however, it is relatively minor.
What Is Induced Drag?
Induced drag is the unavoidable penalty paid for generating lift. When a wing creates lift, it also creates a pressure difference — high pressure below, low pressure above. At each wingtip, high-pressure air from below curls upward around the tip toward the low-pressure region above, forming wingtip vortices. These rotating masses of air tilt the local lift vector rearward, and the rearward component of that tilted force is induced drag. The stronger the lift being generated, the stronger the vortices and the greater the induced drag.
Here is the key insight: the airplane must generate more lift at slow speeds (a higher angle of attack) to support the same weight. Therefore, induced drag is inversely related to airspeed squared — as speed decreases, induced drag increases sharply; as speed increases, induced drag decreases rapidly. Fly fast enough and induced drag becomes almost negligible; fly slowly enough and it can become the dominant drag force. High-aspect-ratio wings (long and slender) are more efficient at generating lift with less induced drag, which is why gliders have very long wings.
The Total Drag Curve: Adding Them Together
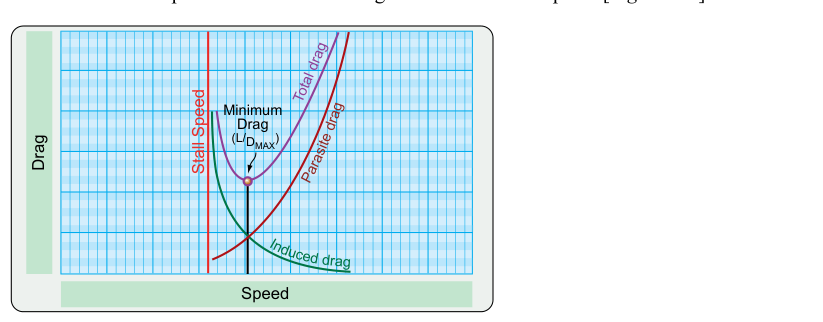
When you plot both parasite drag and induced drag on a graph with airspeed on the horizontal axis and drag force on the vertical axis, you get two curves that slope in opposite directions. Parasite drag rises steeply to the right (increasing speed), while induced drag falls steeply to the left (decreasing speed). When you add the two curves together at every airspeed, you create the total drag curve, which is a characteristic U-shaped (or bucket-shaped) curve.
The bottom of that U — the airspeed at which total drag is at its absolute minimum — is critically important. It is called L/Dmax, the speed of maximum lift-to-drag ratio. At this exact airspeed, the parasite drag and induced drag are equal to each other, and their combined total is lowest. No other airspeed produces less total drag for a given weight.
Why L/Dmax Matters in Practice
The speed for L/Dmax is directly tied to two of the most important airspeeds in your aircraft's performance data. For a glider or a power-off glide in any airplane, flying at L/Dmax gives you the greatest horizontal distance per unit of altitude lost — this is your best glide speed (VG). If your engine fails, flying at VG maximizes your options by covering the most ground. For a powered airplane, flying at the L/Dmax airspeed requires the least thrust to maintain level flight, which means the engine is burning the least fuel per unit of time at that power setting — this approximates the speed for maximum range (technically maximum range involves propeller efficiency corrections, but L/Dmax is the foundation). Flying either slower or faster than L/Dmax demands more total drag to be overcome, requiring more power and burning more fuel.
Key Numbers and Rules
- Parasite drag ∝ V²: Doubles airspeed → four times the parasite drag. This is why high-speed flight is so fuel-hungry.
- Induced drag ∝ 1/V²: Halves airspeed → four times the induced drag. This is why slow flight and stall approaches are drag-intensive.
- At L/Dmax: Parasite drag equals induced drag. This is the single most efficient airspeed for the airplane at a given weight.
- Weight affects L/Dmax: A heavier aircraft must fly faster to reach L/Dmax because it needs more lift, shifting the entire induced drag curve upward and the L/Dmax airspeed to the right on the graph.
- Configuration changes drag: Extending flaps or landing gear adds massive amounts of parasite drag, raising the entire parasite drag curve and shifting the total drag curve upward, reducing efficiency at all speeds.
- Thrust required equals total drag: In level flight, the thrust required to maintain any given airspeed equals the total drag at that speed. This is why the total drag curve is sometimes called the "thrust required" curve.
- Left side of the curve — the "region of reversed command": On the left side of the total drag curve, flying slower actually requires more power (more thrust) to maintain level flight, not less. This counterintuitive region is called the region of reversed command or the backside of the power curve — an important concept for slow-flight training and approach-to-stall awareness.
Why It Matters for Safety
The total drag curve is not just an academic concept — it has direct safety implications. Pilots who do not understand the region of reversed command may be surprised that adding back-pressure on the controls during a slow approach causes the aircraft to sink rather than climb, because the increased angle of attack generates more induced drag without enough airspeed to convert that angle into useful lift. Recognizing that you are operating on the backside of the power curve tells you that the correct recovery is to add power, not just pull back.
Additionally, understanding how weight shifts L/Dmax means you should check your aircraft's performance charts for the actual best-glide speed at your current weight. Many POHs publish best-glide speed for maximum gross weight; if you are lighter, your actual best-glide speed is slightly lower. Using the published speed when lighter is still safe and conservative, but awareness of the relationship helps you understand why.
Wingtip vortices — the source of induced drag — also pose a direct wake turbulence hazard from large aircraft. A heavy jet generating enormous lift at a slow approach speed is producing maximum induced drag and correspondingly powerful wingtip vortices. Lighter following aircraft must maintain appropriate spacing because those vortices are most intense at low speed and high lift — exactly the conditions during approach and departure.
Common Test Traps
- Confusing the direction of change: Students often misremember which drag increases with speed. Remember: parasite drag is the one that grows with speed (it acts like a parasite that gets worse as you push harder). Induced drag is the one that shrinks with speed.
- Forgetting that induced drag equals parasite drag at L/Dmax: The FAA often asks what is true at the speed of minimum total drag. The answer is that the two components are equal, not that one is zero.
- Misidentifying best-glide vs. best-endurance: Best-glide (maximum range) corresponds to L/Dmax. Best endurance (minimum fuel burn per hour, keeping the airplane flying as long as possible) corresponds to the speed of minimum power required, which is slightly slower than L/Dmax — a common source of confusion.
- Assuming more back-pressure always helps on approach: On the backside of the power curve, pulling back increases induced drag and can worsen a sink rate. The FAA tests awareness of the region of reversed command and the correct recovery (add power first).
- Ignoring the effect of weight on best-glide speed: The FAA may present a scenario where an aircraft is below gross weight and ask about the appropriate best-glide speed. The correct answer is that L/Dmax shifts to a lower airspeed at lower weights, though using the published figure is still acceptable and safe.
Memory Aid
Use the phrase "PIE goes UP, I goes DOWN" to keep the relationships straight: Parasite drag Increases with sEpeed (PIE = Parasite Increases with spEed), while Induced drag decreases (goes down) as speed increases. When the two lines cross at the bottom of the total drag curve, you have found your most efficient airspeed.
Mastering the total drag curve gives you a mental model that makes dozens of other aerodynamic concepts — stall speed, climb performance, glide range, fuel planning, wake turbulence — far more intuitive. It is one of the true foundational ideas of aviation, and the time spent understanding it deeply pays dividends throughout your flying career.