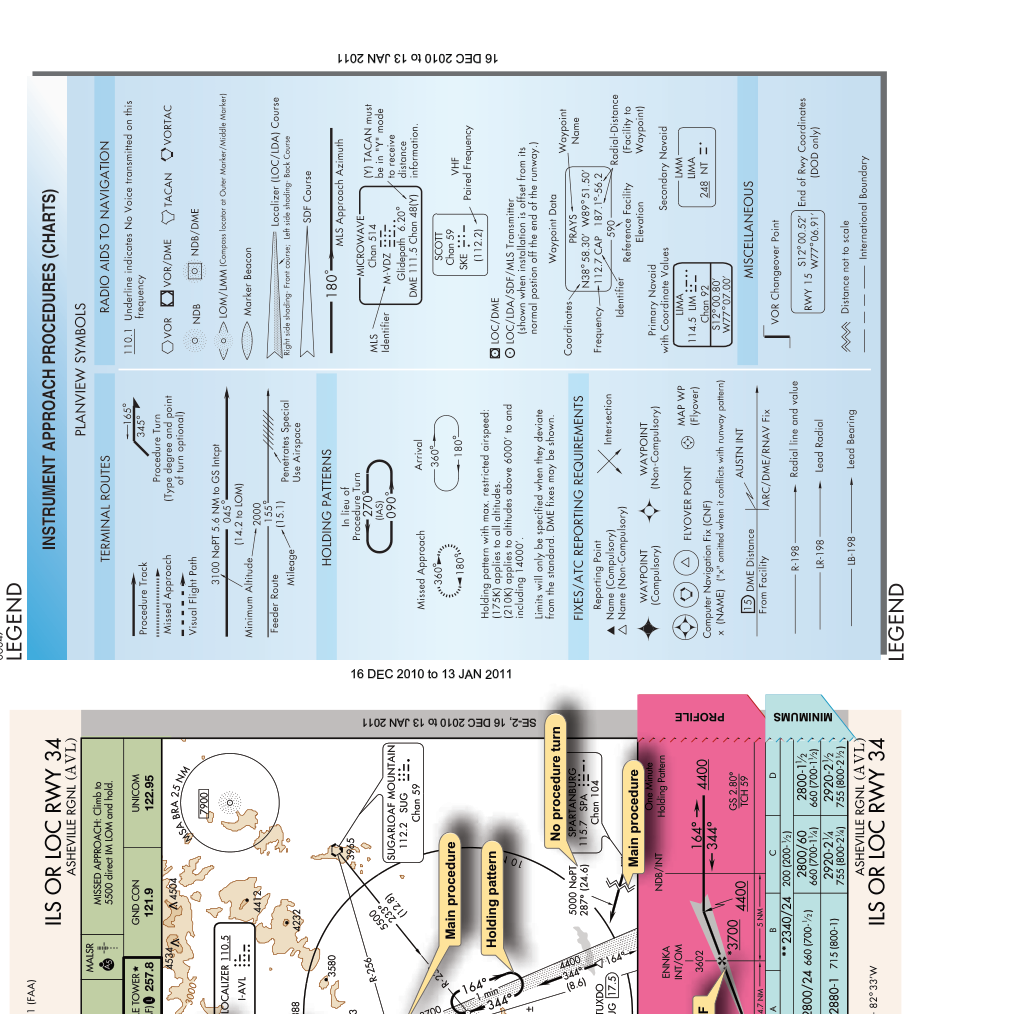
When you pick up an instrument approach chart, the first large graphic element you encounter is the plan view — a bird's-eye depiction of the airspace surrounding the airport and the paths you will fly to get there. Unlike the profile view below it, which shows altitudes along a vertical slice of the approach, the plan view gives you horizontal situational awareness: where fixes are, how the final approach course aligns with the runway, what terrain and obstacles lurk in the vicinity, and — critically — what altitude keeps you safely clear of everything even before you start the formal approach. Understanding every symbol and annotation in the plan view is fundamental to flying IFR safely and passing the FAA Instrument Rating Knowledge Test.
This article unpacks the major features of the plan view, with special emphasis on the Minimum Safe Altitude (MSA) circle, the most prominent altitude protection device depicted in that area of the chart.
Anatomy of the Plan View
The plan view is drawn to scale — but that scale varies from chart to chart, so always check the scale bar printed nearby before drawing any spatial conclusions. The plan view typically includes the following major elements.
Airport and Runway Depiction
Near the center of the plan view you will find a simplified airport diagram showing runway orientation. This immediately tells you the approximate direction from which you will be landing. On straight-in approaches the final approach course generally aligns within 30 degrees of a runway centerline; circling approaches may have a larger offset. The airport symbol also anchors your mental picture of everything else on the chart.
Procedure Course Lines and Fixes
Bold lines trace the paths of the initial, intermediate, and final approach segments. Each segment is annotated with magnetic course, distance in nautical miles, and the names of the fixes that define segment transitions. Fixes may be depicted as named intersections (defined by VOR radials, DME arcs, GPS waypoints, or NDB bearings), outer markers, locator outer markers, or final approach fixes (FAF). The FAF is marked with a Maltese cross (⊕) on the profile view, but on the plan view it appears as a named fix along the course line.
Procedure turns and holding-in-lieu-of-procedure-turn (HILPT) patterns are also shown in the plan view, with their course and distance constraints labeled. The barbed arrow of a procedure turn indicates the side on which maneuvering is authorized. When a hold replaces the procedure turn, a racetrack symbol appears with the holding course and the holding fix labeled.
Terrain and Obstacle Representation
The plan view portrays the general terrain character of the area. Spot elevations of significant obstacles (towers, terrain peaks, antennas) may be shown in small numerals. Shaded or screened areas can indicate rising terrain or obstacles penetrating certain surfaces. This information helps you appreciate the obstacle environment even before you look at the minimum altitudes specified in other parts of the chart. However, the plan view is not a substitute for thorough preflight terrain analysis; it provides a general picture, not a comprehensive obstacle database.
Navaid Depictions
VORs, NDBs, and ILS components are depicted with their standard symbols. Each navaid box lists the facility name, identification, frequency, and Morse code identifier. DME arcs, when part of the approach, are shown as curved lines with distances annotated. GPS waypoints for RNAV approaches appear as named five-letter fixes with their coordinates implied by the procedure design.
Airspace and Communication Boundaries
In some plan views you will see depictions of Class B, C, or D airspace boundaries relevant to the approach environment, along with sector boundaries for approach control. These help you visualize when to expect handoffs and when you transition from en route to terminal airspace.
The Minimum Safe Altitude (MSA) Circle
Arguably the most important altitude reference in the plan view is the MSA circle, also called the emergency safe altitude in some contexts. Here is a thorough breakdown of what it is, what it guarantees, and what it does not.
Definition and Purpose
The MSA is a depicted altitude that provides at least 1,000 feet of obstacle clearance within a defined area centered on a specific navaid or fix associated with the approach — typically the primary navaid of the approach procedure (a VOR, NDB, ILS localizer, or airport reference point for RNAV approaches). The MSA is published solely for emergency use. It is intended as a last-resort altitude if navigation, communication, or other equipment failures force you to deviate from the published procedure before you are established on the approach.
The MSA Circle Geometry
The standard MSA circle has a radius of 25 nautical miles from the reference navaid or fix. In some cases, a radius of up to 30 nautical miles may be used when terrain or obstacle complexity demands it. The circle is divided into sectors — typically two or four — each of which may have a different MSA value. This sectoring reflects the fact that terrain is rarely symmetric around an airport; a mountainous quadrant to the north may demand a dramatically higher MSA than a flat plain to the south. Each sector is annotated with its own altitude, so you must be in the correct sector for the published value to apply to your position.
The sectors are defined by magnetic bearings from the reference fix. For example, a chart might show one sector labeled 090° — 270° and another labeled 270° — 090°, with different altitudes in each half. When four sectors are used, they are typically defined in 90-degree quadrants. The reference fix name is always printed inside or adjacent to the circle so you know which navaid it is centered on.
What the MSA Guarantees — and What It Does Not
The MSA guarantees 1,000 feet of obstacle clearance within its sector and radius — nothing more. It does not guarantee the following:
- Navigation signal coverage. You may be beyond the reliable service volume of a VOR or NDB at the MSA altitude, especially in mountainous terrain. Do not assume navigation guidance simply because you are at or above the MSA.
- Radar coverage. ATC radar may not paint you at low altitudes or in complex terrain even at the MSA.
- IFR en route or approach minimums. The MSA is entirely separate from the Minimum Descent Altitude (MDA), Decision Altitude (DA), or any published segment altitude. It provides a safety floor for emergencies, not a clearance to descend to it as part of a normal approach.
- Terrain clearance beyond the 25 NM ring. If you are farther from the reference fix than the stated radius, the MSA figure has no meaning for your position.
Practical Use of the MSA
In normal IFR operations you will rarely cite the MSA in your everyday planning, because you are protected by your en route MEAs, MORAs, and the published approach segment altitudes. However, the MSA becomes critically relevant in two scenarios: an in-flight emergency requiring immediate level flight while you sort out the problem, and a scenario where ATC is unable to provide radar vectors and you need to know a safe orbit altitude in the vicinity of the airport. Knowing where the MSA sectors are before you begin a complicated approach — especially in mountainous or unfamiliar terrain — is sound cockpit resource management.
Why the Plan View Features Matter for Safety
The plan view is not decorative. Every element serves situational awareness. A pilot who understands the plan view before entering the terminal environment can answer critical questions in advance: Where is the FAF relative to my current position? Which direction does the procedure turn go? What is safe to do if I lose communications or have a partial panel emergency? What navaid frequency must be set before this segment? These answers come from a disciplined pre-approach briefing that starts with the plan view.
Spatial disorientation and controlled flight into terrain (CFIT) accidents in instrument conditions frequently involve pilots who did not fully internalize the plan view — they were unaware of terrain to one side of the course, or they misidentified their position relative to the airport. The FAA emphasizes approach chart study as a risk-management discipline, not just a procedural formality.
Key Numbers and Rules
- MSA obstacle clearance: 1,000 feet within the depicted sector and radius.
- Standard MSA radius: 25 NM from the reference navaid or fix; up to 30 NM when warranted by terrain.
- MSA purpose: Emergency use only — it is not an approach segment altitude or an en route altitude.
- Sector definition: Two to four sectors defined by magnetic bearings; each may carry a different altitude value.
- Plan view scale: Variable — always note the scale bar; do not estimate distances by eye without it.
- Procedure turn protected side: The barbed arrow in the plan view indicates the authorized maneuvering side.
- HILPT symbol: A racetrack pattern replaces the procedure turn barb when a hold-in-lieu-of-procedure-turn is required.
Common Test Traps
- Confusing the MSA with approach minimums. The FAA knowledge test frequently presents the MSA as if it were the MDA or DA. Remember: MSA is emergency obstacle clearance only — you cannot descend to it as part of a normal approach.
- Assuming one MSA value applies everywhere. If the circle is sectored, the altitude printed in your sector applies only to your position within that sector. Using the wrong sector's altitude could put you below the obstacle clearance margin.
- Ignoring the reference fix for the MSA. The MSA is centered on a stated navaid, not necessarily on the airport itself. For approaches where the primary navaid is several miles from the field, the 25 NM ring may not be centered on the runway threshold.
- Treating plan view obstacle data as comprehensive. The plan view shows selected significant obstacles but is not a complete listing. It is a situational awareness aid, not an obstacle database replacement.
- Misreading the procedure turn barb direction. The barb points toward the side on which turns are made; turning to the opposite side is not authorized and violates protected airspace assumptions built into the procedure design.