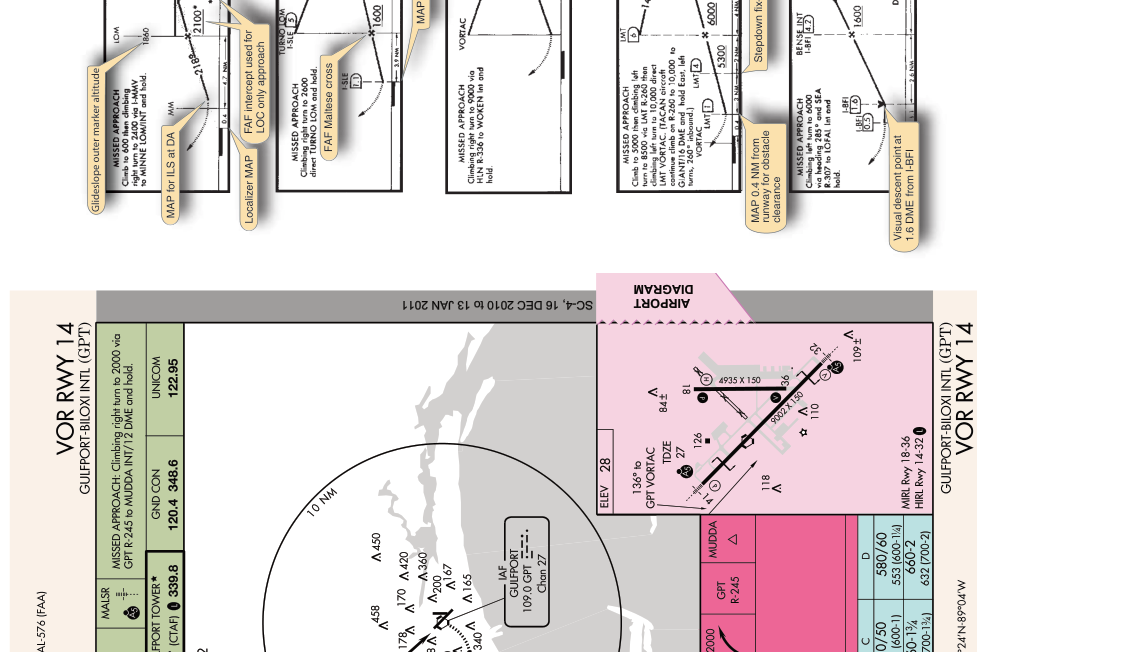
When you pick up an instrument approach chart and look at the profile view — that side-by-side, cross-sectional drawing beneath the plan view — you are looking at the vertical story of the approach. While the plan view tells you where to fly horizontally, the profile view tells you how low you can go and when. Every altitude restriction, every stepdown fix, every glidepath angle, and every missed approach point lives in this drawing. For the instrument rating knowledge test and, far more importantly, for flying actual IFR, understanding how to read and use the profile view is non-negotiable.
This article breaks down every element of the profile view, explains descent gradients mathematically and practically, and highlights the test traps that catch pilots who only glanced at this section instead of truly studying it.
Anatomy of the Profile View
The profile view is drawn as if you sliced the approach procedure from the side and are watching the aircraft descend toward the runway. It reads left to right, generally depicting the final approach fix (FAF), intermediate fixes or stepdown fixes, the missed approach point (MAP), and the runway threshold. Key elements include:
- Final Approach Fix (FAF): On non-precision approaches, the FAF is depicted with a Maltese cross symbol. On precision approaches, the point where the glideslope/glidepath is intercepted inbound is depicted with a lightning-bolt symbol; this glideslope intercept point is where your final descent begins on an ILS-type approach.
- Stepdown Fixes: On non-precision approaches, one or more fixes between the FAF and the MAP may require you to maintain a minimum altitude until crossing the fix before descending further. These are depicted as vertical lines with crossing fixes and associated minimum altitudes.
- Glidepath Angle: On precision approaches (ILS, LPV, LNAV/VNAV) the glidepath is depicted as a dashed or solid descent line with the angle labeled — most commonly 3.00°, though you will encounter steeper angles of 3.5° or even higher at some airports.
- Altitudes at Fix Points: Bold numbers above the profile line show minimum crossing altitudes (MCAs) or segment altitudes. Underlined altitudes indicate mandatory crossing altitudes — not a minimum, not a maximum, but an exact requirement.
- Decision Altitude/Height (DA/DH) and Minimum Descent Altitude (MDA): The lowest usable altitude is shown near the MAP. For precision approaches, this is a DA (you initiate a missed approach when reaching this altitude unless the runway environment is in sight). For non-precision approaches, this is an MDA (you may not descend below it unless you have the required visual references and can make a normal landing).
- Visual Descent Point (VDP): When present, the VDP is shown in the profile view as a small "V" symbol. It marks the point on the final approach course from which a normal descent from MDA to the runway touchdown zone can be made. Flying past the VDP before descending from MDA results in a dive-and-drive scenario that may make a stabilized landing impossible.
- Missed Approach Segment: The profile view shows the climb gradient required after the MAP, often depicted as an arrow climbing away from the runway with a required climb gradient in feet per nautical mile (e.g., 200 ft/NM).
Understanding Descent Gradients
A descent gradient on an approach chart is expressed as a degree angle (e.g., 3.00°) and, for non-precision approaches, sometimes also as a vertical descent angle (VDA). Understanding the math behind these numbers allows you to fly a stabilized approach and recognize when something is wrong.
Converting Degrees to Feet per Nautical Mile
A standard 3° glidepath descends approximately 318 feet per nautical mile. A quick rule of thumb: multiply your groundspeed in knots by 5 to find the required descent rate in feet per minute for a 3° path. For example, at 90 knots groundspeed: 90 × 5 = 450 feet per minute. At 120 knots: 120 × 5 = 600 feet per minute. This relationship holds reasonably well for angles between 2.5° and 4°, making it a practical cockpit tool.
For steeper angles, the required descent rate increases proportionally. A 4° glidepath at 90 knots requires roughly 90 × (4/3) × 5 = 600 feet per minute. Always cross-check your vertical speed indicator against the published angle to confirm you are on the correct path.
Non-Precision Vertical Descent Angle (VDA)
Many non-precision approach charts now include a VDA — a computed advisory angle that describes a path from the FAF altitude to the threshold crossing height. Importantly, the VDA is advisory only. It gives you a smooth, stabilized path to aim for, but it does not replace the MDA as the floor. You must still level off at the MDA unless you have the required visual references. The VDA is there to help you avoid the destabilizing "dive and drive" technique, where a pilot rapidly descends to MDA and then flies level, searching for the runway — a technique that can result in late or impossible-to-complete landings.
Stepdown Fix Geometry
When a non-precision approach includes a stepdown fix, the profile view shows a stair-step descent rather than a continuous slope. You must not descend below the altitude published for the initial segment until you have positively identified the stepdown fix. Crossing a stepdown fix early (i.e., descending before reaching it) is not merely a procedural error — it reduces the obstacle clearance that was carefully computed for that segment. The final MDA already accounts for the lowest safe altitude after all stepdown fixes have been crossed, so the sequence matters enormously.
Precision vs. Non-Precision: A Profile View Comparison
On an ILS approach profile view, you will see the glideslope depiction beginning at the FAF (the point at which you intercept the glideslope inbound), a continuous descent line to the DA, and then a missed approach climb. The altitude at the FAF on an ILS is not a floor you level off at — once established on the glideslope, you follow it continuously down to DA. You also note a glide slope intercept altitude shown at the point where the final approach course meets the glideslope, which protects you from descending below the glideslope on the way in.
On a non-precision approach (LNAV, VOR, NDB), the profile is a series of altitudes separated by fixes. The descent is procedural: descend to a fix altitude, then further to the next, then to MDA. There is no electronic glidepath pulling you down continuously. This is why non-precision approaches demand more pilot discipline and attention to position than precision approaches.
LNAV/VNAV and LPV approaches are published with a glidepath angle and provide vertical guidance, but the floor is still a DA. Their profile views look similar to an ILS, and flying them should feel similarly stabilized — follow the needle, reach DA, decide.
Why the Profile View Matters for Safety
Most Controlled Flight Into Terrain (CFIT) accidents on approaches involve pilots who either did not understand the minimum altitudes shown in the profile view, descended below MDA without the required visual references, or missed a stepdown fix and descended too early. The profile view is literally a picture of the obstacle environment below the approach path — every altitude shown represents terrain or obstacle clearance computed by the FAA. Treat every number on that view as a hard limit, not a suggestion.
Additionally, understanding the VDP prevents a dangerous late-game dive to the runway. If you reach the VDP and the runway is not in sight, you are already past the point where a normal, stabilized landing is feasible. Execute the missed approach.
Key Numbers and Rules
- Standard glidepath angle: 3.00° — descends approximately 318 ft/NM, or roughly 5 × groundspeed in knots = descent rate in ft/min.
- DA (precision): Initiate the missed approach when the altimeter reads DA unless required visual references are clearly in sight and a normal landing can be made.
- MDA (non-precision): Do not descend below MDA until you have the required visual references listed in 14 CFR 91.175(c) and can make a normal landing from there.
- VDA: Advisory only — it helps you fly a stabilized path to MDA, but does not authorize descent below MDA.
- Stepdown fixes: Must be positively identified before descending to the next lower altitude.
- Underlined altitudes: Mandatory — neither a minimum nor a maximum, but an exact crossing requirement.
- Missed approach climb gradient: Published in feet per NM; convert to ft/min using: ft/min = (gradient in ft/NM × groundspeed in knots) ÷ 60.
Common Test Traps
- Confusing DA with MDA: The FAA tests whether you know that at a DA you initiate a missed approach as you reach the altitude, while at an MDA you level off and may not descend further unless you have the required visual references. Mixing these up on the test — or in the airplane — is a critical error.
- Treating the VDA as a floor: The VDA is advisory. Students incorrectly think that because the profile shows a descent path, they are authorized to follow it all the way to the runway. The MDA is still the legal floor on a non-precision approach.
- Ignoring stepdown fixes: Test questions often present a scenario where the aircraft has not yet crossed a stepdown fix and ask what the minimum altitude is. The answer is the higher altitude published for the segment before the stepdown fix, not the MDA.
- Misreading underlined altitudes: An underlined altitude on the profile is mandatory, meaning you must cross at that exact altitude — not at or above, not at or below. Some students assume all profile altitudes are minimums.
- Forgetting the missed approach climb gradient: The knowledge test may ask you to compute whether your aircraft can meet the published climb gradient after a missed approach. Use the formula: required ft/min = (gradient in ft/NM × groundspeed in knots) ÷ 60.