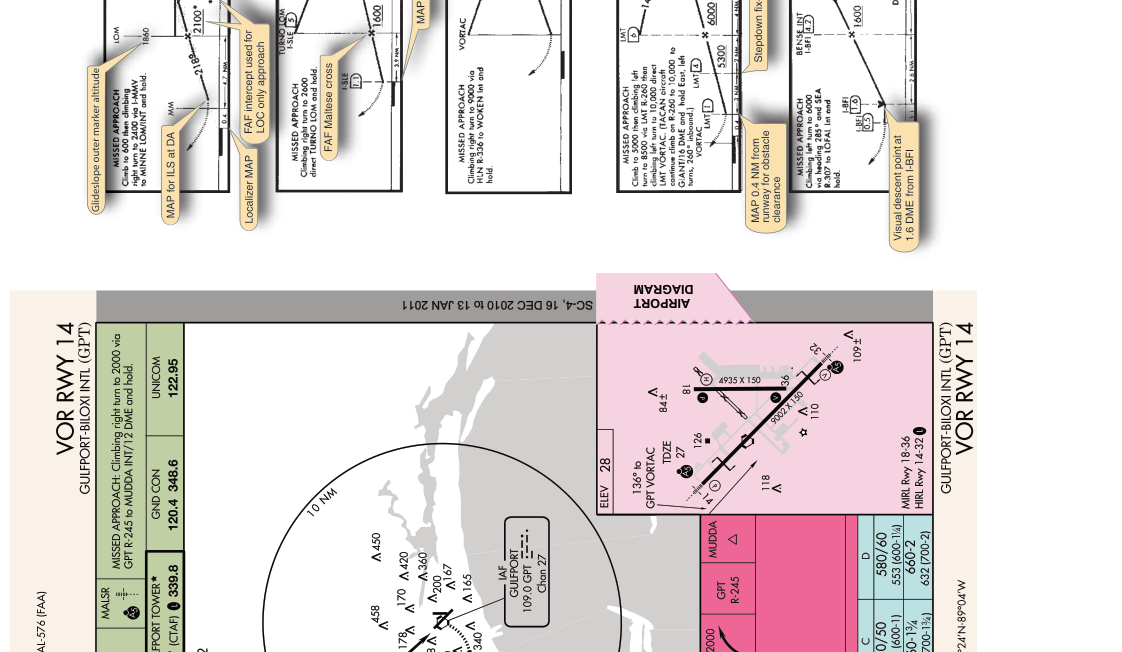
When you unfold an instrument approach chart and look at the profile view — that cross-sectional side view running beneath the plan view — you are looking at the vertical architecture of the approach. Every altitude restriction, every descent gradient, and every stepdown fix printed there has been engineered by the FAA to keep your aircraft safely above terrain and obstacles while guiding you down toward the runway environment. For instrument-rated pilots and candidates alike, reading the profile view fluently is not optional: the FAA knowledge test probes it directly, and in actual IMC, misreading a single altitude can be fatal.
This article unpacks the profile view in full — how descent gradients are defined and published, what stepdown fixes are and why they exist, how the visual descent point fits in, and how all of these elements interact on both precision and non-precision approaches. By the end, you will be able to look at any profile view and immediately understand what it is demanding of you and why.
Anatomy of the Profile View
The profile view is a stylized cross-section that is not drawn to scale but does preserve the correct sequence of fixes and the relative vertical relationships between them. It shows the approach from the final approach fix (FAF) — or, on an ILS, from the glideslope intercept point — all the way to the missed approach point (MAP) and the beginning of the missed approach procedure. Key elements you will always find include:
- The final approach fix (FAF): Depicted by a Maltese cross (X) on non-precision approaches and by the glideslope intercept point on precision approaches. This is where you begin your final descent.
- Stepdown fixes: Intermediate fixes between the FAF and the MAP that impose a minimum altitude you must maintain until crossing that fix.
- Minimum descent altitude (MDA) or decision altitude (DA): The floor of the approach — MDA for non-precision, DA for precision.
- Touchdown zone elevation (TDZE) and threshold crossing height: Published near the runway end in the profile view to give context for your visual flare.
- Vertical angle or gradient: The published descent angle or rate, often shown alongside the glidepath symbol or in a data block.
- Visual descent point (VDP): Marked with a "V" on the profile view when published; the point from which a normal visual descent to the runway can be made.
Descent Gradients: How They Are Defined
A descent gradient on an approach chart expresses how steeply the approach path descends. The FAA publishes this in two related ways: as a vertical angle in degrees (e.g., 3.00°) and as a descent gradient in feet per nautical mile (ft/NM). The standard non-precision approach gradient is 318 ft/NM, which corresponds to approximately 3.0° — the same angle used for a standard ILS glideslope. Steeper gradients, sometimes 400–500 ft/NM, appear when terrain or obstacles force a higher FAF altitude relative to the runway elevation.
In the cockpit, you convert the gradient to a feet-per-minute rate of descent using your groundspeed. The working formula is: Rate of descent (ft/min) = Gradient (ft/NM) × Groundspeed (NM/min). For example, at 90 knots groundspeed (1.5 NM/min) on a 318 ft/NM gradient: 318 × 1.5 = 477 ft/min. Many approach charts also publish a table in the lower margin listing recommended rates of descent for common approach speeds, saving you the mental math in the cockpit.
On a precision approach (ILS, LPV, GLS), the glideslope or glidepath electronically defines the descent gradient, typically 3°. The profile view shows the glideslope as a solid line descending from the glideslope intercept altitude to the decision altitude. On a localizer-only approach (a non-precision variant of the ILS), the glideslope is flagged and you follow the non-precision profile with stepdowns instead.
Stepdown Fixes: Purpose and Use
A stepdown fix is an intermediate fix along the final approach segment that allows lower minimum altitudes to be published — but only after you have positively identified the fix. The logic is straightforward: obstacle clearance criteria require a specified buffer above any obstacle along the approach path. If a significant obstacle sits close to the runway, the FAA might need to raise the FAF crossing altitude dramatically to clear it for the entire final segment. A stepdown fix lets the chart say: "Stay at or above 2,400 feet until crossing ALPHA fix, then you may descend to 1,800 feet, and then to MDA after the FAF." This gives you a lower MDA — and thus better approach minimums — without sacrificing obstacle clearance.
You identify a stepdown fix using the same navigation resources available for the approach: a crossing radial from a VOR, a DME reading, a GPS waypoint, or an NDB bearing. On the profile view, stepdown fixes appear as vertical lines with their name and the minimum altitude printed above the line. The altitude shown is always a minimum — you may not descend below it until you have crossed the fix. Crossing early is a significant error; descending below the stepdown altitude before the fix removes the obstacle clearance buffer the FAA engineered into the procedure.
An important subtlety: if your aircraft or avionics cannot positively identify a stepdown fix, you must use the higher altitude for the entire segment as if the stepdown fix did not exist. In practice, modern GPS-based approaches eliminate many traditional stepdown fixes by substituting GPS waypoints, which is one reason RNAV approaches often have lower minimums than their VOR or NDB counterparts.
The Visual Descent Point
The visual descent point (VDP) is a defined point on the final approach course from which a normal descent from MDA to the runway touchdown zone can be accomplished. It is only published when it can be identified by the pilot — typically using DME or a GPS distance readout. On the profile view it is marked with a bold "V."
The VDP matters because diving steeply from MDA to the runway after the MAP is both unsafe and contrary to stabilized approach standards. If you reach the VDP and do not have the required visual references, you should plan to execute the missed approach at or before the MAP. Arriving at the MAP still at MDA without a VDP published means you must use your own judgment about whether a safe visual descent is achievable — and if in doubt, you go missed.
Why It Matters: Safety and Regulatory Grounding
The obstacle clearance surfaces that govern every altitude on the profile view are defined in FAA approach design criteria (see the Instrument Procedures Handbook, FAA-H-8083-16). For a non-precision approach, the FAA guarantees at least 250 feet of clearance above the highest obstacle in the final approach segment — but only if you follow the published altitudes precisely. Descend below the MDA without adequate visual reference and that guarantee evaporates. Descend below a stepdown fix altitude before crossing the fix and you may have obstacle clearance as low as zero.
14 CFR 91.175 governs approach and landing under IFR. It requires that you not descend below MDA or DA unless the aircraft is continuously in a position from which a normal landing can be made and the required visual references are clearly visible. Understanding the profile view is what gives you the situational awareness to respect that rule intelligently rather than just mechanically.
Key Numbers and Rules
- Standard approach gradient: 318 ft/NM ≈ 3.0° — the baseline for most non-precision and all standard ILS approaches.
- Obstacle clearance on final (non-precision): Minimum 250 ft above the highest obstacle in the final approach segment when at or above MDA.
- Rate of descent formula: ft/NM × (groundspeed ÷ 60) = ft/min required.
- Stepdown fix requirement: Must positively identify the fix before descending to the lower altitude; if fix is not identifiable, use the higher altitude.
- VDP identification: Only published where a pilot can identify it with onboard navigation; typically DME or GPS distance from threshold.
- MDA vs. DA: MDA applies to non-precision approaches — you level off and look; DA applies to precision approaches — you decide at that exact altitude, not below it.
- Missed approach point: On non-precision approaches, the MAP may be a fix, a timing point, or a DME distance — always identified in both the profile view and the briefing strip.
Common Test Traps
- Confusing the FAF Maltese cross with a stepdown fix: The Maltese cross (X) always marks the FAF on a non-precision approach. Stepdown fixes use a plain vertical line. Mixing them up leads to wrong answers about where final descent begins.
- Treating stepdown altitudes as targets rather than minimums: You may not descend below a stepdown altitude before the fix — but the test sometimes implies you must descend to it immediately. Stepdowns are floors, not assigned altitudes.
- Confusing groundspeed with indicated or true airspeed: The gradient table in the chart margin uses groundspeed, not true airspeed or indicated airspeed. The test may ask you to compute a rate of descent given a specific groundspeed — use that groundspeed directly.
- Assuming a VDP is always published: A VDP is only published when it can be identified. Many approaches have no VDP. If none is shown, it does not mean the approach is unusable — it means you manage the visual segment using your own technique and judgment.
- Ignoring TDZE when interpreting MDA: MDA is expressed as MSL, but obstacle clearance is calculated relative to TDZE. A high-elevation airport can have an MDA that appears large in absolute terms but actually represents a relatively small height above the touchdown zone — understanding this prevents confusion about actual approach minimums.