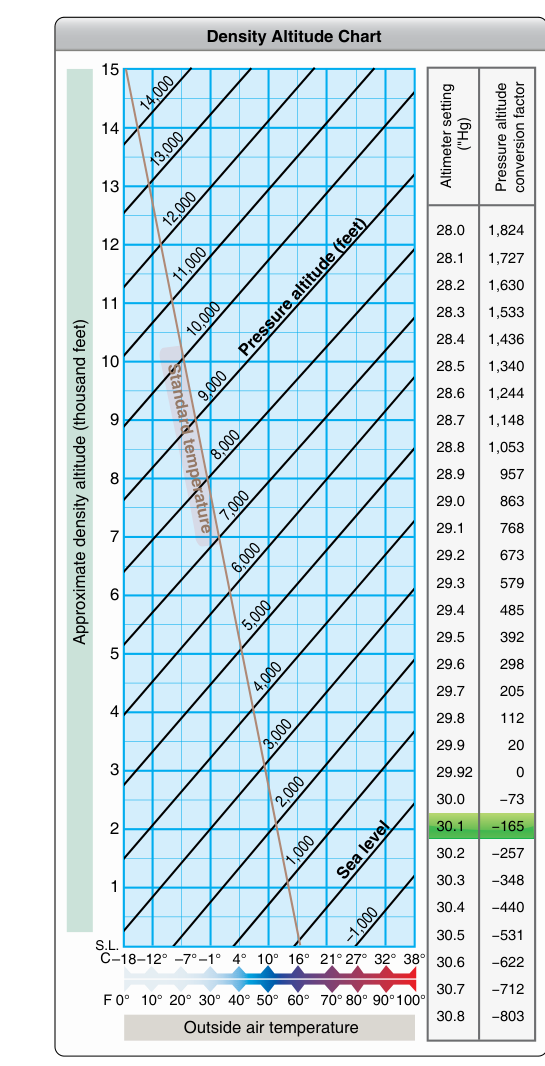
On a sweltering summer afternoon at a high-elevation airport, an aircraft that flew perfectly in cool sea-level air may struggle to climb, accelerate, or even lift off at all. The reason is density altitude — one of the most important and frequently misunderstood performance concepts in general aviation. The FAA knowledge test tests it directly, but more importantly, misunderstanding density altitude has contributed to numerous fatal accidents. This article will explain exactly what density altitude is, how it is calculated, why it degrades performance, and how you apply it during preflight planning.
At its core, density altitude is simple: it is pressure altitude corrected for non-standard temperature. It represents the altitude in the International Standard Atmosphere (ISA) that corresponds to the actual air density you are flying in. If the air around your aircraft is less dense than standard air at that elevation, your aircraft "thinks" it is at a much higher altitude — and performs accordingly.
Understanding the Building Blocks
To grasp density altitude, you need to understand two related concepts first: pressure altitude and the International Standard Atmosphere (ISA).
Pressure altitude is the altitude indicated on your altimeter when the altimeter's Kollsman window is set to 29.92 in. Hg (the standard sea-level pressure). It reflects how far above the standard pressure datum your aircraft currently sits, regardless of the actual temperature. At sea level on a standard day, pressure altitude equals field elevation.
The International Standard Atmosphere defines a set of agreed-upon atmospheric conditions: sea-level pressure of 29.92 in. Hg, sea-level temperature of 15°C (59°F), and a standard lapse rate of approximately 2°C per 1,000 feet of altitude gained. When conditions match the ISA, density altitude equals pressure altitude. Any deviation — particularly warmer-than-standard temperatures — pushes density altitude above pressure altitude.
How Density Altitude Is Calculated
There are three practical ways to determine density altitude before a flight:
- Flight computer (E6-B): Set pressure altitude against outside air temperature on the density altitude window. The answer appears directly. This is the most common method for the written test.
- POH performance charts: Most Pilot's Operating Handbooks include charts or tables that input pressure altitude and temperature to give you takeoff distance, climb rate, and other performance data — effectively baking density altitude into the answer.
- Approximate rule of thumb: A commonly used rule of thumb is that for every 1°C that the actual temperature exceeds the standard temperature at a given pressure altitude, density altitude rises roughly 120 feet above pressure altitude. This figure is an approximation, not an exact FAA-published constant, and it varies somewhat by altitude — but it helps you quickly sense how much the temperature is hurting you.
To find the standard temperature at any pressure altitude, use the ISA formula: start at 15°C at sea level and subtract 2°C for every 1,000 feet. For example, at 5,000 feet pressure altitude, standard temperature is 15 − (5 × 2) = 5°C. If the actual temperature on that day is 25°C, you are 20°C above standard. Multiplying by 120 feet/°C gives approximately 2,400 additional feet — meaning density altitude is roughly 7,400 feet even though your field sits at 5,000 feet pressure altitude.
Factors That Increase Density Altitude
Three environmental factors reduce air density and therefore raise density altitude:
- High temperature: Warm air expands, spacing air molecules farther apart and reducing density. This is the most operationally significant factor at low-elevation airports because pilots often underestimate how much a hot summer day affects performance at a low-elevation field.
- High elevation: As altitude increases, atmospheric pressure drops, and there are fewer air molecules per cubic foot. High-elevation airports (Rocky Mountain states, for example) begin with a significant density altitude penalty even on a cool day.
- High humidity: This one surprises many students. Water vapor (H₂O, molecular weight ~18) displaces denser nitrogen and oxygen molecules (molecular weights 28 and 32). Moist air is therefore slightly less dense than dry air at the same temperature and pressure. While humidity's individual effect is smaller than temperature or elevation, it compounds the other two factors and should not be dismissed on hot, muggy days.
How High Density Altitude Degrades Aircraft Performance
Every performance parameter your aircraft has is predicated on the engine and airframe interacting with a specific mass of air. When density altitude is high, that mass decreases — and performance suffers across the board.
Engine power: Reciprocating (piston) engines are particularly sensitive to air density. A normally aspirated engine ingests a fixed volume of air per intake stroke; with less dense air, fewer oxygen molecules enter the cylinders, fuel burn must be reduced to maintain the correct mixture, and the engine produces less horsepower. Turbocharged engines compensate by compressing the intake air, but even they have a critical altitude above which they can no longer maintain sea-level power. As a commonly cited rule of thumb, a normally aspirated engine loses roughly 3% of its rated horsepower for every 1,000-foot increase in density altitude — though this figure is an approximation rather than a precise regulatory value, and pilots should treat it as a rough guideline and always defer to the POH for actual performance figures.
Propeller efficiency: A propeller generates thrust by accelerating a mass of air rearward. In thinner air, each blade bite moves less mass, reducing thrust even if the engine were producing full power. Both engine power loss and propeller efficiency loss act simultaneously, compounding the performance degradation.
Lift and indicated airspeed vs. true airspeed: Lift is generated by air flowing over the wings. With lower-density air, the wing must move faster through the air (higher true airspeed) to generate the same lift it would at sea level. Your indicated airspeed — which is driven by the dynamic pressure the pitot tube senses — will still read essentially the same rotation and liftoff speed for a given weight and configuration. However, the true airspeed at rotation will be much higher, meaning the aircraft covers significantly more ground distance before it can fly. This directly increases your takeoff roll.
Climb performance: With less excess thrust available (engine and prop both weakened) and the aircraft needing a higher true airspeed, climb gradients and climb rates decrease substantially. Obstacles that were easily cleared at sea level can become genuine threats at high density altitude.
Practical Application: Planning the Flight
Always calculate density altitude before any flight where performance is a concern — which, in practice, means any day that is hot, any airport at a meaningfully higher elevation, and any aircraft operating near its gross weight.
Start by obtaining the field elevation and current altimeter setting. Convert field elevation to pressure altitude: for every 0.01 in. Hg that the altimeter setting deviates from 29.92, pressure altitude changes by approximately 10 feet. If the altimeter reads 29.72 (0.20 below standard), pressure altitude is roughly 200 feet higher than field elevation. Then use your E6-B or POH charts to find density altitude using the actual outside air temperature at the surface.
Enter your aircraft's performance charts with that density altitude (or the combination of pressure altitude and temperature, depending on how the chart is structured). Be conservative: use the unfactored chart distances and then apply any manufacturer-recommended safety factors. The FAA recommends treating POH performance numbers as achievable only under ideal conditions — new aircraft, experienced pilot, smooth runway. Real-world distances are often longer.
Key Numbers and Rules
- Standard sea-level conditions: 15°C, 29.92 in. Hg
- Standard temperature lapse rate: ~2°C per 1,000 feet
- Approximate density altitude increase for temperature above standard: ~120 feet per 1°C above ISA (rule of thumb, not an exact constant)
- Typical normally aspirated engine power loss: ~3% per 1,000 feet of density altitude (approximate rule of thumb)
- When density altitude equals pressure altitude: only when temperature is exactly standard (ISA)
- Humidity effect: adds to density altitude but is smallest of the three primary factors; most significant when combined with high temperature
Common Test Traps
- Confusing pressure altitude and density altitude: Density altitude accounts for temperature; pressure altitude does not. On a hot day, density altitude is always higher than pressure altitude. The test often presents a scenario where students select pressure altitude as their performance input — always correct for temperature.
- Assuming high humidity improves performance: Some students reason that moisture makes air "heavier" — in fact, moist air is slightly less dense than dry air at the same conditions, raising density altitude and reducing performance.
- Ignoring density altitude at low-elevation airports: A sea-level airport on a 38°C (100°F) day can easily have a density altitude above 3,000 feet. Low elevation does not mean performance is unaffected on hot days.
- Reading POH charts at field elevation instead of pressure altitude: Charts that use pressure altitude as an input require the pilot to first convert field elevation using the altimeter setting — skipping this step underestimates density altitude.
- Forgetting that high density altitude affects landing too: Although the airplane lands at the same indicated airspeed, the higher true airspeed means longer landing rolls, less effective braking relative to ground speed, and steeper go-around challenges if needed.