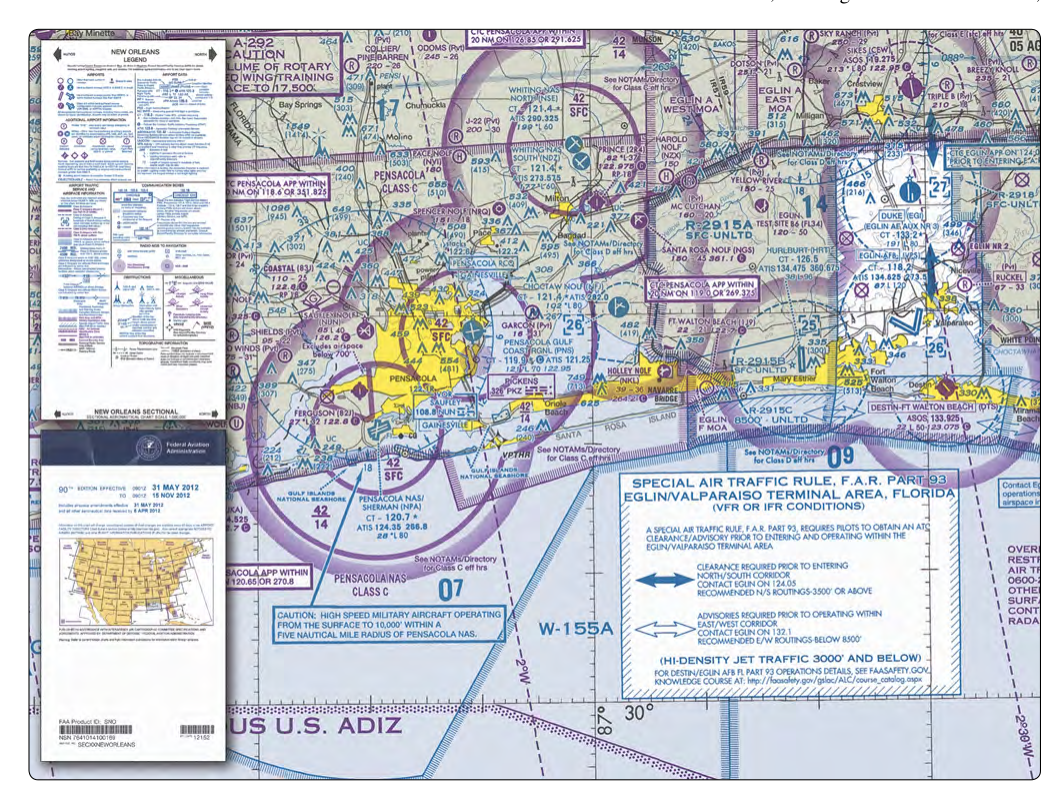
The VFR sectional aeronautical chart is the foundational navigation document for visual flight rules flying in the United States. Produced and published by the FAA's Aeronautical Information Services on a 1:500,000 scale, sectionals cover the continental United States, Alaska, and Hawaii in overlapping panels. Every feature printed on the chart — from a tiny private grass strip to a Class B airspace shelf — is defined in the legend printed on the chart's reverse side. Learning to read that legend fluently is not optional; it is a core private pilot skill that directly affects situational awareness, airspace compliance, and terrain avoidance.
This article walks through the major symbol categories you will encounter on a sectional chart, explains the logic behind each, and highlights the details most commonly tested on the FAA Private Pilot Knowledge Test. References throughout are grounded in the Pilot's Handbook of Aeronautical Knowledge (FAA-H-8083-25) and the Aeronautical Chart User's Guide published by the FAA.
Understanding the Scale and Projection
Sectional charts use a Lambert Conformal Conic projection, which preserves the shape of features well across the mid-latitudes of the continental United States. The 1:500,000 scale means one inch on the chart equals roughly 6.86 nautical miles on the ground. This makes sectionals practical for low- to medium-altitude VFR navigation — detailed enough to identify towns and terrain features, but not so detailed that the chart becomes unwieldy. Terminal Area Charts (TACs) cover the busiest Class B airspace areas at 1:250,000, twice the detail, and use the same symbol set.
Terrain and Elevation Symbols
Terrain is depicted using two complementary systems: contour lines and hypsometric tinting (color shading). Contour lines connect points of equal elevation above mean sea level (MSL), with a standard contour interval of 500 feet on most sectional panels. Where terrain is steep and contours would be too close together to read individually, spot elevations — small bold numbers — mark the highest known point in a given area. The highest elevation on an entire quadrant is printed in large bold type as the Maximum Elevation Figure (MEF), shown in thousands and hundreds of feet MSL. For example, an MEF of 72 means 7,200 feet MSL. The MEF already includes a buffer above the highest known terrain or obstacle in that quadrant, providing a quick reference for obstacle and terrain clearance during VFR cruise.
Color shading moves from green (low elevations near sea level) through tan, brown, and gray as elevation increases, giving pilots an immediate visual sense of mountainous versus flat terrain before they even look at a number. Darker browns and grays signal high, potentially hazardous terrain.
Airport Symbols
Airports are among the most important symbols to recognize instantly. The FAA uses several variations:
- Magenta circle with tick marks: An airport with no control tower. A solid magenta circle means a private or restricted-use airport; a circle with tick marks (resembling a small compass rose) means a public-use airport. Hard-surface runways are shown with a filled symbol; soft-surface or water runways use different shading.
- Blue circle with tick marks: A public-use airport that has an operating control tower. Blue = tower. Magenta = no tower. This color distinction is critically important for airspace awareness.
- Associated data block: Printed next to each airport symbol is a data block listing the airport name, elevation in feet MSL, the symbol for available services (fuel, lighting, etc.), the UNICOM or CTAF frequency, and — for towered airports — the ATIS and tower frequencies. The runway length shown represents the longest runway in hundreds of feet (e.g., 35 means 3,500 feet).
- Lighting indicator: A small star or the letter L adjacent to the airport symbol indicates that runway lighting is available. An asterisk (*) means part-time or pilot-controlled lighting.
Airspace Symbols
Airspace boundaries are drawn with specific line types and colors, each tied to a class of airspace defined in 14 CFR Part 71.
- Class B airspace: Depicted with solid blue lines. The concentric arcs resemble an upside-down wedding cake when viewed in three dimensions. Each arc is labeled with a ceiling and floor in hundreds of feet MSL (e.g., 100/50 means from 5,000 to 10,000 feet MSL).
- Class C airspace: Depicted with solid magenta lines. Typically two concentric circles around a primary airport, again labeled with ceiling/floor values.
- Class D airspace: Depicted with a dashed blue circle around a towered airport. The ceiling is shown in a small box in hundreds of feet MSL. Class D typically extends from the surface up to around 2,500 feet AGL, but the actual ceiling varies by location and is always shown in the airspace data box on the chart — always check the published figure rather than assuming a fixed number.
- Class E airspace starting at the surface: A dashed magenta circle around certain airports indicates Class E airspace starting at the surface, typically established to support instrument approaches at non-towered fields.
- Class E at 700 feet AGL: A fuzzy or vignette magenta border (the boundary fades to the inside) marks where Class E begins at 700 feet AGL — the transition area that protects aircraft flying instrument approaches. Outside this boundary, Class E typically begins at 1,200 feet AGL.
- Class E at 1,200 feet AGL (floor): Most of the en-route airspace in the contiguous U.S. is Class E starting at 1,200 feet AGL, depicted with a broad blue vignette line. No special symbol is needed because it is the default.
Obstacle Symbols
Man-made obstacles are critical for VFR pilots flying at lower altitudes. The sectional chart distinguishes between two height thresholds:
- Obstacles under 1,000 feet AGL: Shown as a small symbol (the classic lightning-bolt or tower icon) in blue or magenta without a ring. The elevation above MSL is printed next to the symbol, with the height above ground in parentheses.
- Obstacles 1,000 feet AGL and above (high-intensity): Shown with a bold symbol and surrounded by a small dot cluster or bold type. These are the obstacles most dangerous to VFR flight and include tall broadcast towers, wind turbine farms, and similar structures.
- Groups of obstacles: Where multiple towers cluster in a small area, a group symbol is used rather than individual depictions, to avoid cluttering the chart.
Special Use Airspace
Special Use Airspace (SUA) appears in distinct hatching or outlining patterns with alphanumeric identifiers:
- Prohibited Areas (P): Blue hatching. Flight is prohibited at all times under 14 CFR Part 73 (e.g., P-40 over Camp David, P-56 over Washington D.C.).
- Restricted Areas (R): Blue hatching with an R identifier. Operations may be permitted under certain conditions; contact ATC or check NOTAMs.
- Warning Areas (W): Blue hatching offshore, indicating potential hazards to non-participating aircraft. Not regulated within U.S. airspace law in the same way, but treated with caution.
- MOAs (Military Operations Areas): Magenta hatching with the MOA name. VFR flight is legal but risky; contact the controlling agency for activity status.
- Alert Areas (A): Magenta hatching, indicating high volumes of pilot training or unusual aerial activity. All aircraft — military and civilian — share responsibility for collision avoidance.
Navigation Aids
VOR stations appear as a compass-rose circle with a six-pointed star at the center. The station name, frequency, Morse code identifier, and channel number are printed in a data box. A VOR with co-located DME is noted; a VORTAC adds TACAN capability for military users. NDB stations (now rare) appear as a small dot with a circle and a flag symbol.
Key Numbers and Rules
- Scale: 1:500,000 (1 inch ≈ 6.86 nautical miles)
- Contour interval: 500 feet on most panels
- Blue airport symbol = towered (operating control tower); Magenta = non-towered
- MEF values include a buffer above terrain and obstacles — treat them as minimum safe altitudes for that quadrant
- Class D depicted with dashed blue circle; Class C with solid magenta; Class B with solid blue
- Fuzzy magenta border = Class E beginning at 700 feet AGL
- Obstacles ≥ 1,000 feet AGL are high-intensity obstacles, depicted with bold symbology
- Sectional charts are updated every six months; always use a current edition
Common Test Traps
- Blue vs. magenta airport confusion: Many students reverse these. Remember: Blue = control tower (think of the blue uniform an air traffic controller might wear). Magenta = no tower.
- MEF misreading: The MEF number is in thousands and hundreds of feet. A value of 82 is 8,200 feet MSL, not 82 feet. Always read the legend note on the chart.
- Fuzzy vs. solid magenta border: The FAA test loves to show both types. The fuzzy (vignette) magenta line marks 700-foot AGL Class E floors; the solid magenta line marks Class C boundaries. Confusing them is a very common error.
- Dashed magenta vs. dashed blue circles: Both appear near airports. Dashed magenta = Class E surface area. Dashed blue = Class D. Same shape, different color, completely different rules.
- Assuming chart currency: Sectionals expire every six months. Using an outdated chart is illegal under 14 CFR and practically dangerous — new obstacles, airspace changes, and frequency updates may not appear on an old edition.
Mastering sectional chart symbols takes practice with an actual chart in hand, not just memorization of lists. Spread a current sectional on a table, find examples of each symbol type described above, and verify them against the printed legend. Pair that hands-on study with chart-reading practice on FAA sample questions, and you will find that symbol recognition becomes second nature well before your knowledge test date.