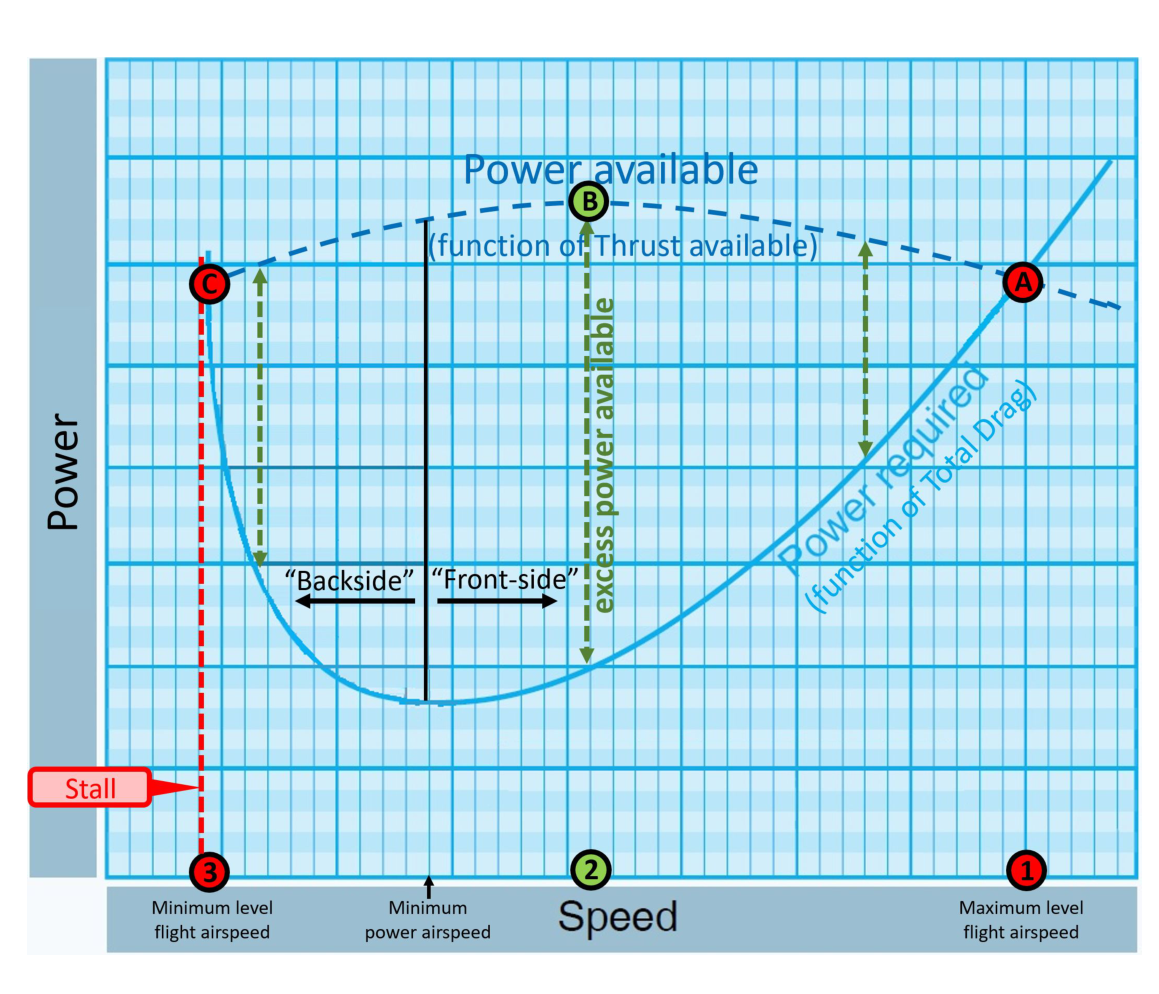
Most of the time, a pilot's instincts serve them well: reduce power to slow down, add power to speed up, pull back to climb. But there exists a specific corner of the flight envelope where those instincts become dangerous liabilities. This region is called the region of reversed command—popularly known as the "back side of the power curve"—and it is one of the most important aerodynamic concepts a flight or ground instructor must master and teach with genuine depth. Understanding it means understanding not just a textbook curve, but the physics of energy management, the psychology of surprised pilots, and the mechanics behind some of the most tragic accident patterns in general aviation.
Building the Drag Curve from First Principles
To fully appreciate the region of reversed command, start with the total drag curve as described in the Pilot's Handbook of Aeronautical Knowledge (PHAK, FAA-H-8083-25). Total drag on an aircraft is composed of two broad families: parasite drag and induced drag. Parasite drag encompasses form drag, skin friction drag, and interference drag—every penalty the airframe pays simply for moving through the air. Its defining characteristic is that it rises with the square of airspeed. Double the speed, and parasite drag quadruples. At cruise and high-speed flight, parasite drag dominates the equation entirely.
Induced drag, on the other hand, is the aerodynamic penalty for producing lift. Every time a wing generates lift, it also generates a rearward-tilted resultant force because the local airflow is deflected downward. As airspeed decreases, the wing must fly at a progressively higher angle of attack to generate the same lift force. Higher angles of attack mean more pronounced downwash, stronger wingtip vortices, and dramatically higher induced drag. Induced drag varies inversely with the square of airspeed: halve the speed and induced drag quadruples. At slow airspeeds, induced drag dominates completely.
Plot both components against airspeed and then add them together. The result is the iconic U-shaped total drag curve. Parasite drag climbs steeply to the right; induced drag climbs steeply to the left. Their sum reaches a distinct minimum at an intermediate airspeed. That minimum point is L/Dmax—the airspeed at which the lift-to-drag ratio is greatest. For most light single-engine training aircraft, L/Dmax typically falls near the published best-glide speed (VG), often somewhere in the range of 60 to 80 knots depending on the specific design and weight. This is also the airspeed at which a gliding aircraft achieves maximum range over the ground. The PHAK devotes detailed attention to this point because it is the aerodynamic hinge on which the region of reversed command swings.
The Two Sides of the Curve
Front Side: Normal Command
At airspeeds above L/Dmax, the aircraft operates on the front side of the power curve, where command relationships feel intuitive. Here, parasite drag dominates. If the aircraft slows slightly, total drag decreases, which means less thrust is required to maintain level flight—so the aircraft naturally tends to accelerate back toward its trimmed airspeed. Similarly, to fly slower, the pilot reduces power. To fly faster, the pilot adds power. This is the world of normal cruise flight, and it matches the instincts pilots develop from their earliest hours.
Back Side: Reversed Command
At airspeeds below L/Dmax, the aircraft enters the back side of the power curve. Here, induced drag is the governing force. As airspeed decreases below L/Dmax, induced drag rises faster than parasite drag falls, so total drag increases as speed decreases. The consequence is profound: the aircraft now requires more thrust to maintain level flight at a slower airspeed. The familiar relationship between power and speed has completely reversed. Slower flight costs more energy, not less. This is the region of reversed command.
The instability this creates is equally important. If an aircraft on the back side of the curve loses a small amount of airspeed, drag increases, the aircraft decelerates further, drag increases more, and the cycle compounds. Without prompt corrective action—specifically, the addition of power and a reduction in angle of attack—the aircraft enters what the PHAK describes as a "mushing" condition: a descent that cannot be arrested by back pressure alone. In an extreme case, with insufficient power available and airspeed continuing to decay, the wing approaches its critical angle of attack and a stall becomes imminent.
Required Power vs. Available Power
The power-required curve reinforces this understanding. Power required equals thrust-required multiplied by airspeed. At L/Dmax, power required is not at its minimum—minimum power required occurs at an airspeed slightly lower than L/Dmax. This is the speed for maximum endurance in a piston aircraft (sometimes called VBE). Below that airspeed, power required climbs steeply, and at some very slow airspeed, the power required to maintain level flight exceeds the maximum power the engine can produce. At that point, the aircraft cannot maintain altitude regardless of pilot inputs, even at full throttle. This is the aerodynamic basis behind the tragic full-power, nose-high, sink-into-terrain accident sequence that appears repeatedly in NTSB reports involving approach-to-landing stall-spin accidents.
Where Reversed Command Appears in Real Operations
Pilots do not need to seek out a test maneuver to encounter the back side—it appears routinely in normal operations. Any of the following scenarios can place an aircraft on or near the back side of the power curve:
- Slow-flight practice conducted at airspeeds near or below VG with flaps extended, as required by the Private Pilot ACS.
- Short-field and soft-field approach and landing, where obstacle clearance demands a steep, slow approach profile.
- Traffic pattern operations at low altitude with a stabilized approach speed below best-glide—normal and expected, but requiring active power management.
- Go-around initiation from a slow, high-drag configuration (full flaps, low airspeed) where initial power application may not immediately arrest a descent because the aircraft is deep on the back side.
- Formation flying or speed-matched operations where pilots must hold airspeeds slower than their normal approach speeds.
None of these scenarios is inherently catastrophic. Pilots operate on the back side of the power curve routinely and safely. The danger arises when the pilot does not recognize the condition, applies intuitive but incorrect inputs (pulling back without adding power), or lacks the situational awareness to act promptly.
Teaching the Concept in the Cockpit
As an instructor, demonstrations beat descriptions. During slow-flight setup, have the student establish level flight at an airspeed below L/Dmax with power stabilized. Then have them apply gentle back pressure without adding power. The aircraft will not climb—it will sink and slow simultaneously, with the stall warning horn creeping closer. Next, demonstrate that recovery requires both nose-down input to reduce angle of attack and simultaneous power addition. This dual response directly contradicts the instinct to simply pull up when the ground is approaching. Connecting the felt experience to the drag curve diagram afterward deepens retention dramatically, consistent with the instructional principles in the Aviation Instructor's Handbook (FAA-H-8083-9).
Key Numbers and Rules
- L/Dmax is the boundary between front-side and back-side operations; it approximates best-glide speed (VG) for most light aircraft.
- Minimum power-required speed is slightly slower than L/Dmax and approximates maximum endurance airspeed.
- Induced drag varies inversely with V2; parasite drag varies directly with V2—both relationships are squared, making small speed changes highly consequential near L/Dmax.
- A stall is caused by exceeding the critical angle of attack (approximately 15–20° for most airfoils), not by airspeed alone—back-side flight and stalls are related but distinct concepts.
- Recovery from back-side mushing always requires reducing angle of attack and adding power; back pressure alone worsens the situation.
Common Test Traps
- Equating L/Dmax with minimum power speed. They are different airspeeds. L/Dmax is the minimum-drag airspeed; minimum power required occurs at a somewhat slower speed. Flight instructor knowledge tests often probe this distinction.
- Assuming only slow-flight maneuvers place an aircraft on the back side. Normal approaches routinely operate there. The question is always whether the pilot is managing power actively.
- Believing the back side is always dangerous. It requires awareness and technique—it is not categorically unsafe. The hazard is surprise and incorrect response, not the region itself.
- Confusing increased angle of attack with recovery. On the back side, more back pressure means more induced drag and a deeper energy deficit. Recovery demands the opposite: unload the wing, add power.
- Thinking a stall only occurs on the back side. A stall can occur at any airspeed on either side of the curve if the critical angle of attack is exceeded—for example, an accelerated stall at cruise speed during an aggressive pull-up.
Memory Aid
The phrase "Slow means more go" is a reliable classroom anchor. On the back side of the power curve, slower flight demands more power, not less. It captures the reversal precisely and students who learn it early tend to recall it under pressure during ground evaluation.