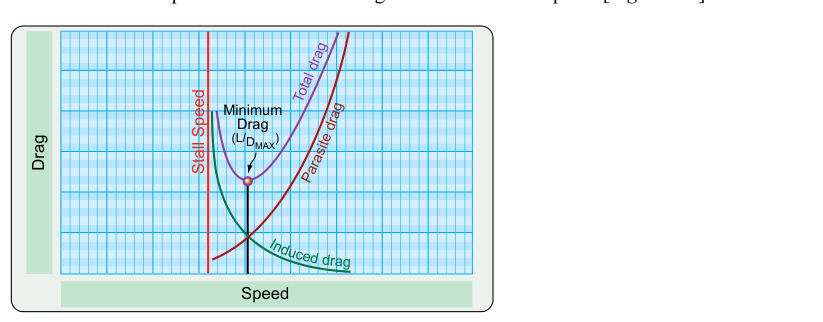
Two families of drag act on every airplane in flight, and understanding them deeply—not just memorizing a definition—separates a competent pilot from one who merely passes a written test. Parasite drag and induced drag have opposite relationships with airspeed, they peak at opposite ends of the flight envelope, and they interact in ways that govern every performance decision from takeoff to landing. For the flight instructor candidate, this topic is doubly important: you must understand the aerodynamics well enough to correct a student's misconceptions in real time, and you must be able to trace those misconceptions back to their root cause.
What Is Parasite Drag?
Parasite drag is the collective resistance produced by every part of the airplane that disrupts airflow without contributing to lift. The FAA Pilot's Handbook of Aeronautical Knowledge (PHAK, FAA-H-8083-25) breaks it into three components. Form drag arises from the shape of the airframe—a blunt, flat surface facing the airstream creates a large low-pressure wake behind it, and the pressure difference between the front and back of the object resists forward motion. Skin-friction drag results from air molecules clinging to the surface and dragging against the boundary layer; even a mirror-smooth wing produces it. Interference drag is generated wherever two surfaces meet and their individual airflows collide—wing-fuselage junctions, strut attachments, and antenna bases are classic examples because the combined turbulence at the junction is worse than the sum of the two surfaces considered separately.
All three components share one defining characteristic: they increase with the square of true airspeed. Double the speed and parasite drag roughly quadruples. This squared relationship means that at high cruise speeds, parasite drag rapidly becomes the dominant source of total drag. Any modification that reduces frontal area, smooths surface irregularities, or eliminates protrusions—retracting landing gear, closing cowl flaps, sealing gaps—directly attacks parasite drag and improves cruise efficiency and range.
What Is Induced Drag?
Induced drag is a necessary consequence of the lift-production process itself—it cannot be eliminated, only managed. When a wing develops lift, there is higher pressure below the wing and lower pressure above it. Near the wingtips, air from the high-pressure region below spills around the tip toward the low-pressure region above, forming rotating vortices that trail behind the aircraft. These vortices impart a downward velocity component to the air behind the wing (downwash), which effectively tilts the local relative wind downward. Because lift is defined as perpendicular to the relative wind, this tilted relative wind rotates the lift vector slightly rearward, and the rearward component of that rotated lift vector is induced drag.
The critical point is that induced drag is directly tied to the coefficient of lift (CL), which in turn is governed by angle of attack. At slow airspeeds the wing must fly at a high angle of attack to generate sufficient lift, the pressure differential across the wing is large, the wingtip vortices are strong, and induced drag is at its maximum. As airspeed increases, the wing can achieve the required lift at a lower angle of attack, the vortex intensity decreases, and induced drag falls. Mathematically, induced drag varies inversely with the square of airspeed—halve your speed and induced drag roughly quadruples.
The Total Drag Curve and L/DMAX
When parasite drag and induced drag are plotted against airspeed on the same graph, their sum—the total drag curve—forms a characteristic U-shape. On the left (slow) side, induced drag dominates and the curve slopes steeply upward as speed decreases. On the right (fast) side, parasite drag dominates and the curve climbs as speed increases. The bottom of the U, the speed at which total drag is at its absolute minimum, is L/DMAX—the speed that yields the best lift-to-drag ratio. This is the aerodynamic sweet spot for efficiency.
L/DMAX has direct operational significance. For an unpowered glider, or for any airplane that has just lost its engine, flying at or near L/DMAX speed (best-glide speed as published in the Pilot's Operating Handbook) maximizes the horizontal distance covered per foot of altitude lost. It is also the theoretical foundation underlying VY (best rate of climb) and VX (best angle of climb). VY occurs near the minimum total drag speed because that is where the greatest excess of power over drag is available, producing the highest rate of energy gain. VX, which prioritizes terrain clearance over rate of altitude gain, sits at a slightly slower speed where the excess thrust over drag is greatest—even though total power available is not maximized there.
The Back Side of the Power Curve
The U-shaped drag curve creates what pilots call the region of reversed command, or the back side of the power curve. To the right of L/DMAX speed, adding thrust accelerates the airplane and more power is required to fly faster—the intuitive, normal relationship. To the left of L/DMAX, something counterintuitive occurs: if the pilot allows airspeed to decay below L/DMAX, total drag increases (because induced drag is now dominant and climbing steeply), and the airplane requires more power to maintain altitude at the slower speed, not less. Students who encounter this for the first time in slow flight training often respond by pulling back on the controls—raising the nose, increasing angle of attack, increasing induced drag further—and inadvertently accelerating the drag spiral. Recognizing this behavior, and understanding its root cause in induced drag physics, is central to slow-flight instruction and stall/spin awareness.
Training Implications Across Maneuvers
Stalls and Angle of Attack
Induced drag peaks at high angles of attack, which means it is at its maximum precisely when the wing is approaching the stall. Any factor that forces the wing to a higher angle of attack—reduced airspeed, increased load factor in a bank, pulling aggressively out of a dive, turbulence-induced gusts—simultaneously maximizes induced drag and brings the wing closer to its critical angle. This is why stall awareness training must address not just slow airspeed but all high-angle-of-attack situations, including accelerated stalls in steep turns.
Turning Flight and Load Factor
In a coordinated level turn, the vertical component of lift must equal aircraft weight while the horizontal component provides centripetal force. To keep both conditions satisfied, total lift must increase. Per the PHAK, in a 60° banked level turn the load factor is 2.0 g—the wing must produce twice the lift it would in level unaccelerated flight. More lift at the same airspeed means a higher angle of attack and therefore substantially more induced drag. Exam questions about drag increases in turns are testing induced drag, not parasite drag.
Cruise Configuration and Range
At typical cruise airspeeds—well to the right of L/DMAX—parasite drag is the controlling factor. Retracting gear and flaps, closing vents, sealing inspection panel gaps, and maintaining a clean airframe directly reduce parasite drag and extend range. This is why manufacturers invest in flush-riveted skins, retractable gear, and streamlined cowlings.
Key Numbers and Rules to Know
- Parasite drag varies with V2: doubling airspeed roughly quadruples parasite drag.
- Induced drag varies inversely with V2: halving airspeed roughly quadruples induced drag.
- L/DMAX speed is where total drag is minimized and glide ratio is maximized—this speed appears in the POH as best-glide speed.
- 60° level bank = 2.0 g load factor, doubling induced drag for the same airspeed.
- VY is near minimum drag speed; VX is slower, where excess thrust (not excess power) is greatest.
- Parasite drag is never zero—form drag and skin-friction drag exist even on a perfectly clean, gear-up aircraft.
Common Test Traps
- "Minimum drag occurs at stall speed." False. Minimum total drag occurs at L/DMAX, which is faster than stall speed. At stall speed, induced drag is very high.
- Reversing which drag dominates at which speed. Slow flight = induced drag dominates. High-speed cruise = parasite drag dominates. Exam writers routinely swap these to catch students who have only memorized labels.
- Assuming load factor increases affect parasite drag. It is induced drag that rises with load factor and lift coefficient. A steep-turn drag question is an induced drag question.
- Treating best-glide speed as a fixed number regardless of weight. L/DMAX speed changes with weight—heavier aircraft must fly faster to achieve the same angle of attack. Many POHs publish best-glide speed at a specific gross weight; the instructor should know to adjust it when significantly below that weight.
- Confusing the region of reversed command with an engine-out condition. The back side of the power curve exists at any power setting; it describes the drag-versus-speed relationship, not a malfunction. A student can inadvertently enter it during a normal approach if airspeed decays below L/DMAX.
Memory Aid
Use the phrase "Parasite Picks up, Induced Inverts" to lock in the relationships: parasite drag picks up (increases) as speed increases; induced drag inverts that pattern and decreases as speed increases. Picture a seesaw balanced at the L/DMAX speed—as the airspeed end rises, parasite drag rises on that side while induced drag falls on the other.