Every time you pull back on the controls, bank into a turn, or fly through turbulence, you are asking the airplane's structure to carry more than its own weight. The technical term for this extra demand is load factor, and it is measured in units called Gs. Understanding load factor — and the diagram that maps its limits — is not only essential for the FAA Private Pilot knowledge test, it is one of the most important concepts in keeping an airplane in one piece.
The V-n diagram (also called the velocity-load-factor diagram) is the engineer's way of displaying, in a single picture, every combination of airspeed and load factor that the airplane is designed to handle. Learning to read it gives you an immediate, visual answer to questions like: "How hard can I pull at this speed?" and "What happens if I exceed this limit?" Let's build up both ideas from the ground up.
What Load Factor Really Means
Load factor is defined as the ratio of the lift being produced to the actual weight of the aircraft. In straight, level, unaccelerated flight the wings produce lift exactly equal to the airplane's weight, so the load factor is 1 — one G. You feel your normal weight in the seat.
When you maneuver, the wings must produce more lift to provide both the force needed to support the weight and the force needed to change the flight path. That extra demand multiplies the structural load. A load factor of 2 means the wings are carrying twice the airplane's weight; every part of the structure — spars, skin, rivets, control linkages — must bear twice the stress it handles in level flight. A load factor of 3 means three times, and so on.
Load factor can also be negative. If you push forward aggressively or encounter a sharp downward gust, the wings may be pushed to produce lift in the opposite direction. Negative Gs are typically more damaging per unit because most light aircraft structures are designed with a smaller margin in the negative direction.
How Bank Angle Drives Load Factor
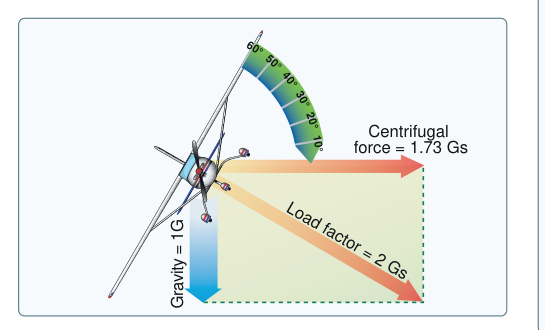
One of the most commonly tested relationships in aerodynamics is the connection between bank angle and load factor in a coordinated, level turn. To maintain altitude while banked, the vertical component of lift must still equal the aircraft weight. As the bank angle increases, more and more of the total lift tilts sideways, so the wings must generate progressively greater total lift to keep the vertical component constant. The math produces a dramatic curve:
- 0° bank: load factor = 1.0 G
- 30° bank: load factor ≈ 1.15 G
- 45° bank: load factor ≈ 1.41 G
- 60° bank: load factor ≈ 2.0 G
- 75° bank: load factor ≈ 3.9 G
- 80° bank: load factor ≈ 5.8 G
Notice how the numbers accelerate rapidly above 60°. A 60° banked turn doubles the structural load — a figure most student pilots find surprising. This is also why stall speed increases in a turn: since the wings must produce more lift, they reach the critical angle of attack at a higher airspeed than in wings-level flight.
The V-n Diagram Explained
The V-n diagram plots airspeed (V) on the horizontal axis and load factor (n) on the vertical axis. The resulting shape is an envelope: the region inside represents combinations of speed and G-load that are within the design limits; anything outside represents structural damage or aerodynamic failure territory.
The Parabolic Stall Boundary
The left side of the diagram curves upward in a parabola. This boundary is not a structural limit — it is the aerodynamic stall boundary. Below and to the left of this curve, the wing cannot generate the indicated G-load because it will stall first. In a sense, the wing protects itself at lower speeds by stalling before it can be overloaded. The top of this parabola meets the structural limit line at a critical airspeed: the maneuvering speed (VA).
Maneuvering Speed (V-A)
Maneuvering speed is one of the most important speeds on the V-n diagram. It is the highest speed at which applying full deflection of a single flight control will cause the airplane to stall before exceeding the positive limit load factor. At or below VA, a single abrupt full-control input cannot bend the airplane. Above VA, the structure can be overstressed before the wing stalls.
Crucially, VA decreases as aircraft weight decreases. A lighter airplane has a lower stall speed at any given load factor, so the parabolic boundary shifts left, and VA moves to a lower value. This is a classic FAA test question: operating at less than gross weight means your published VA is actually higher than the appropriate maneuvering speed for your current weight — you must use a lower speed to stay protected.
Positive and Negative Limit Load Factors
Horizontal lines on the V-n diagram mark the limit load factors — the maximum Gs the aircraft is designed to sustain repeatedly without permanent deformation. For a normal category aircraft the positive limit is +3.8 G and the negative limit is −1.52 G. For a utility category aircraft (approved for limited acrobatics like spins and steep turns) the positive limit is +4.4 G and the negative limit is −1.76 G. Acrobatic category aircraft are certified to +6.0 G positive and −3.0 G negative.
Above the limit load factor lies a zone called the ultimate load factor, set at 1.5 times the limit. The structure is engineered to not fail catastrophically until reaching the ultimate load, but between the limit and ultimate there may be permanent structural deformation. Once you exceed limit load, even if the airplane does not break, the structure may be bent or fatigued in ways invisible to a pre-flight inspection.
The High-Speed (Right) Boundary
On the right side of the diagram, a vertical line marks VNE, the never-exceed speed (the red line on the airspeed indicator). Beyond this speed, the aircraft may experience flutter, control reversal, or structural failure even at low G-loads. The upper right corner of the envelope is therefore doubly forbidden: high speed combined with high G-load represents the most extreme possible structural demand.
Why This Matters: Turbulence and Structural Integrity
Turbulence adds load factor in a way the pilot cannot always control. A sharp updraft gust effectively increases the wing's angle of attack instantaneously, spiking lift — and therefore load factor — without any pilot input. The FAA recommends slowing to maneuvering speed or below when encountering moderate or severe turbulence precisely because at VA the stall boundary acts as a natural G-limiter. Flying fast through turbulence is a recipe for structural damage or failure.
It is also worth understanding that repeated loading near the limit — even if the ultimate load is never reached — contributes to metal fatigue. Cumulative stress cycles can weaken structural components over time, which is why hard landings and turbulence encounters must be documented and sometimes require professional inspection before further flight.
Key Numbers and Rules
- Level flight: load factor = 1.0 G regardless of airspeed.
- 60° banked level turn: load factor = 2.0 G — a common test value.
- Normal category limit load factor: +3.8 G / −1.52 G.
- Utility category limit load factor: +4.4 G / −1.76 G.
- Acrobatic category limit load factor: +6.0 G / −3.0 G.
- Ultimate load factor: 1.5 × limit load factor for each category.
- VA decreases with decreased weight — use a lower speed when operating below gross weight.
- At or below VA: a single full-control input will stall before overstressing the structure.
- VNE: the absolute top of the V-n diagram; never exceed for any reason.
Memory Aid
To remember how bank angle and load factor relate, use the phrase "Sixty Doubles": at sixty degrees of bank, load factor doubles to 2 G. From there, recall that the curve rises steeply — 75° approaches 4 G, and 90° is mathematically infinite (you can never maintain level flight at a true 90° bank). This anchor point helps you reconstruct the rest of the curve on the exam.
Common Test Traps
- VA and weight: Students often think VA is fixed. Remember — the published VA is for maximum gross weight; at lighter weights the correct maneuvering speed is lower.
- "Full control deflection" language: VA protects against a single full-control input. Simultaneous full deflection of multiple controls, or repeated full inputs, can still overstress the structure even below VA.
- Stall speed in turns: The FAA often asks why stall speed increases in a bank. The answer is load factor — not angle of bank directly. It's the increased load that requires more lift and therefore a higher airspeed to avoid the critical angle of attack.
- Negative G limits are smaller: Students assume symmetry. Normal category aircraft tolerate only about 40% as much negative G as positive G, making pushovers and downward gusts proportionally more dangerous structurally.
- Exceeding limit vs. ultimate: Limit load = no permanent deformation intended. Ultimate load = the point of no structural failure guaranteed. Anything above limit load may have permanently damaged the aircraft even if it lands safely — a mandatory inspection trigger.