One of the most revealing diagrams in all of aeronautics is deceptively simple: a pair of curves plotted on a graph of power (or thrust) versus airspeed. On one side is the power required curve — the minimum power the aircraft needs to sustain level, unaccelerated flight at each airspeed. On the other is the power available curve — the power the engine and propeller can actually deliver at those same airspeeds. Where those curves meet, intersect, and diverge tells a pilot nearly everything about performance: how fast the aircraft can go, how slowly it can fly, where it climbs best, and where it reaches its absolute ceiling. Understanding these curves is not just a test requirement — it is the conceptual backbone of every performance decision you make in the cockpit.
Before diving into the curves themselves, it helps to separate thrust from power. Thrust is a force measured in pounds; power is the rate at which work is done, measured in horsepower or foot-pounds per second. For a jet or rocket, aeronautical engineers typically use thrust required vs. thrust available curves because jet engines produce relatively constant thrust over a range of speeds. For propeller-driven aircraft — the type most private pilot students fly — the more useful comparison is power required vs. power available, because a piston engine and propeller are most naturally described in horsepower terms. The FAA's Pilot's Handbook of Aeronautical Knowledge addresses both perspectives, and you should understand how they relate.
The Power Required Curve
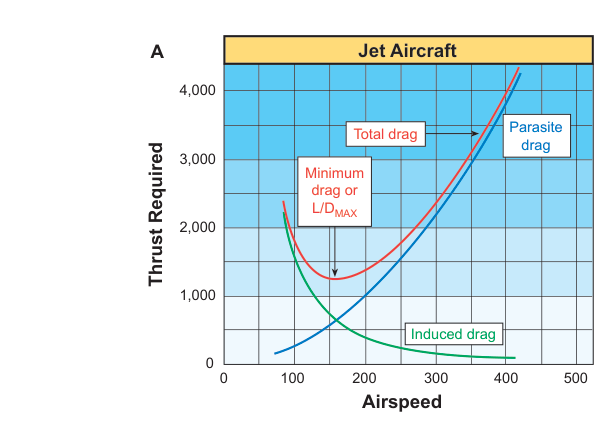
The power required curve (sometimes called the thrust horsepower required curve) has a characteristic U-shape, but with an important asymmetry. It comes from the total drag the aircraft experiences in level flight. To fly level, thrust must equal drag, and power is simply thrust multiplied by velocity. This means:
- At very low airspeeds, induced drag (drag caused by lift generation) is enormous because the wing must fly at a high angle of attack to produce sufficient lift from slower-moving air. The required power is therefore high.
- At very high airspeeds, parasite drag (skin friction, form drag, interference drag) rises steeply — it increases with the square of airspeed, meaning doubling your speed quadruples parasite drag. Required power climbs sharply again.
- Somewhere in between lies the bottom of the U — the speed at which total drag is minimized. This point is called L/Dmax, the speed of maximum lift-to-drag ratio, and it corresponds to the best-glide speed and the minimum drag speed.
The exact shape of the required curve depends on the aircraft's weight, configuration (flaps up or down, gear extended or retracted), and altitude. Heavier weight shifts the entire curve upward and to the right, because more lift — and therefore more induced drag — is needed. Extending flaps dramatically increases the parasite drag component and reshapes the curve.
The Power Available Curve
The power available curve represents how much power the engine-propeller combination can deliver at various airspeeds at a given throttle setting and altitude. For a naturally aspirated piston engine with a fixed-pitch propeller, this curve is not flat. Propeller efficiency changes with airspeed: at very low airspeeds the propeller is relatively inefficient (it is, in effect, over-pitched for the low forward speed), and at very high airspeeds it can again become less efficient as it approaches its aerodynamic limits. The result is a curve that typically rises from a lower value at low airspeed, reaches a peak of maximum efficiency somewhere in the mid-speed range, and then may curve back downward at very high speeds.
With a constant-speed propeller, the governor maintains a selected RPM and adjusts blade pitch to keep the propeller operating near its peak efficiency across a wider range of airspeeds. This makes the power available curve flatter and broader — delivering closer to maximum engine horsepower across a larger portion of the speed range, which improves overall performance flexibility.
What the Intersection Tells You
The power required and power available curves typically intersect at two points. These intersection points are the maximum and minimum level flight airspeeds at that throttle setting and altitude. Between the two intersections, power available exceeds power required — meaning the aircraft can climb or accelerate. Outside the intersections, the required power exceeds what is available, and level flight is impossible at that throttle setting.
- Maximum level flight airspeed (VH): The high-speed intersection. This is the fastest the aircraft can fly in level flight at maximum continuous power. Going faster would require more power than the engine can produce.
- Minimum level flight airspeed: The low-speed intersection (near stall speed in practice). Below this speed, the required power exceeds what is available even at full throttle, and the aircraft cannot maintain altitude.
The vertical distance between the two curves at any airspeed represents excess power. Excess power is what fuels a climb. The speed at which this vertical gap is greatest — where excess power is maximized — corresponds to the speed for best rate of climb (VY). This is a crucial insight: VY is not found by guessing; it lives at the airspeed where the power surplus above the required curve is at its maximum value.
Why It Matters: Performance Decisions in Flight
These curves explain several practical performance relationships that every private pilot should internalize:
- Best range speed: For a piston (propeller) aircraft, best range in level flight occurs at L/Dmax — the minimum drag speed, found where a straight line from the origin is tangent to the bottom of the power-required curve. This is the same speed as best glide. (For a jet, best range instead occurs at a speed faster than L/Dmax, found by the tangent-line construction applied to the power-required curve.)
- Best endurance speed: Maximum endurance (longest time aloft) for a piston aircraft occurs at the airspeed corresponding to minimum power required — the very bottom of the U-shaped curve. The aircraft burns the least fuel per hour at this speed.
- Effect of altitude: As altitude increases, air density decreases. A naturally aspirated engine loses power output, so the power available curve drops. At the same time, the power required curve shifts because the aircraft must fly at a higher true airspeed to produce the same lift (although the indicated airspeed at best performance remains similar). The two curves grow closer together. When they are just barely touching at a single point — tangent to each other — the aircraft has reached its absolute ceiling, where no excess power exists and a climb of even one foot per minute is impossible. The service ceiling is the altitude where only 100 feet per minute of climb rate remains.
- Weight and configuration effects: A heavier aircraft or one with gear and flaps extended requires more power across the board, raising the required curve. This shrinks the excess-power region and reduces climb performance, maximum airspeed, and ceiling.
Thrust Required vs. Thrust Available (Jet Perspective)
For completeness, jet aircraft use a similar analysis in terms of thrust rather than power. The thrust required curve is simply the total drag curve — it has the same U-shape but plotted as pounds of force rather than horsepower. Jet engines tend to produce relatively constant thrust across a range of airspeeds (though it does vary), so the thrust available curve is often drawn as a nearly horizontal line. Maximum airspeed is again where the curves intersect, and excess thrust (the gap between available and required) drives climb performance. The speed for best rate of climb in a jet corresponds to maximum excess thrust.
Key Numbers and Rules
- Power required = Drag × Velocity (in consistent units). More drag or higher speed means more required power.
- Minimum drag speed = L/Dmax = best glide speed = bottom of the drag curve.
- Best endurance (piston): fly at minimum power required — the bottom of the power-required curve.
- Best rate of climb (VY): fly at maximum excess power — the largest gap between power available and power required.
- Absolute ceiling: power available and power required curves are tangent; climb rate = 0 fpm.
- Service ceiling: defined as the altitude where maximum climb rate has dropped to 100 fpm.
- Increasing weight shifts the power required curve upward — worse performance in every regime.
- Increasing altitude lowers the power available curve (naturally aspirated engine) — performance margins shrink.
Common Test Traps
- Confusing best endurance with best range. Best endurance (longest time aloft) is the speed for minimum power required. Best range is the speed for minimum drag (L/Dmax) for a propeller aircraft, but occurs at a faster speed for a jet. The FAA tests this distinction carefully.
- Thinking VY equals L/Dmax. VY is the speed of maximum excess power, which is typically faster than L/Dmax (minimum drag speed) for a piston aircraft. They are related but not the same.
- Assuming power available is constant. With a fixed-pitch propeller, power available varies significantly with airspeed and altitude. Only a turbocharged or supercharged engine can maintain sea-level power to its critical altitude.
- Forgetting that absolute ceiling allows zero climb. A question may ask what climb rate is possible at absolute ceiling — the answer is zero. Service ceiling allows 100 fpm; absolute ceiling allows none.
- Ignoring the effect of weight on the required curve. A heavier aircraft needs more power at every airspeed. This raises the entire required curve, reducing excess power and raising both VY and the stall speed, shrinking the safe operating envelope.