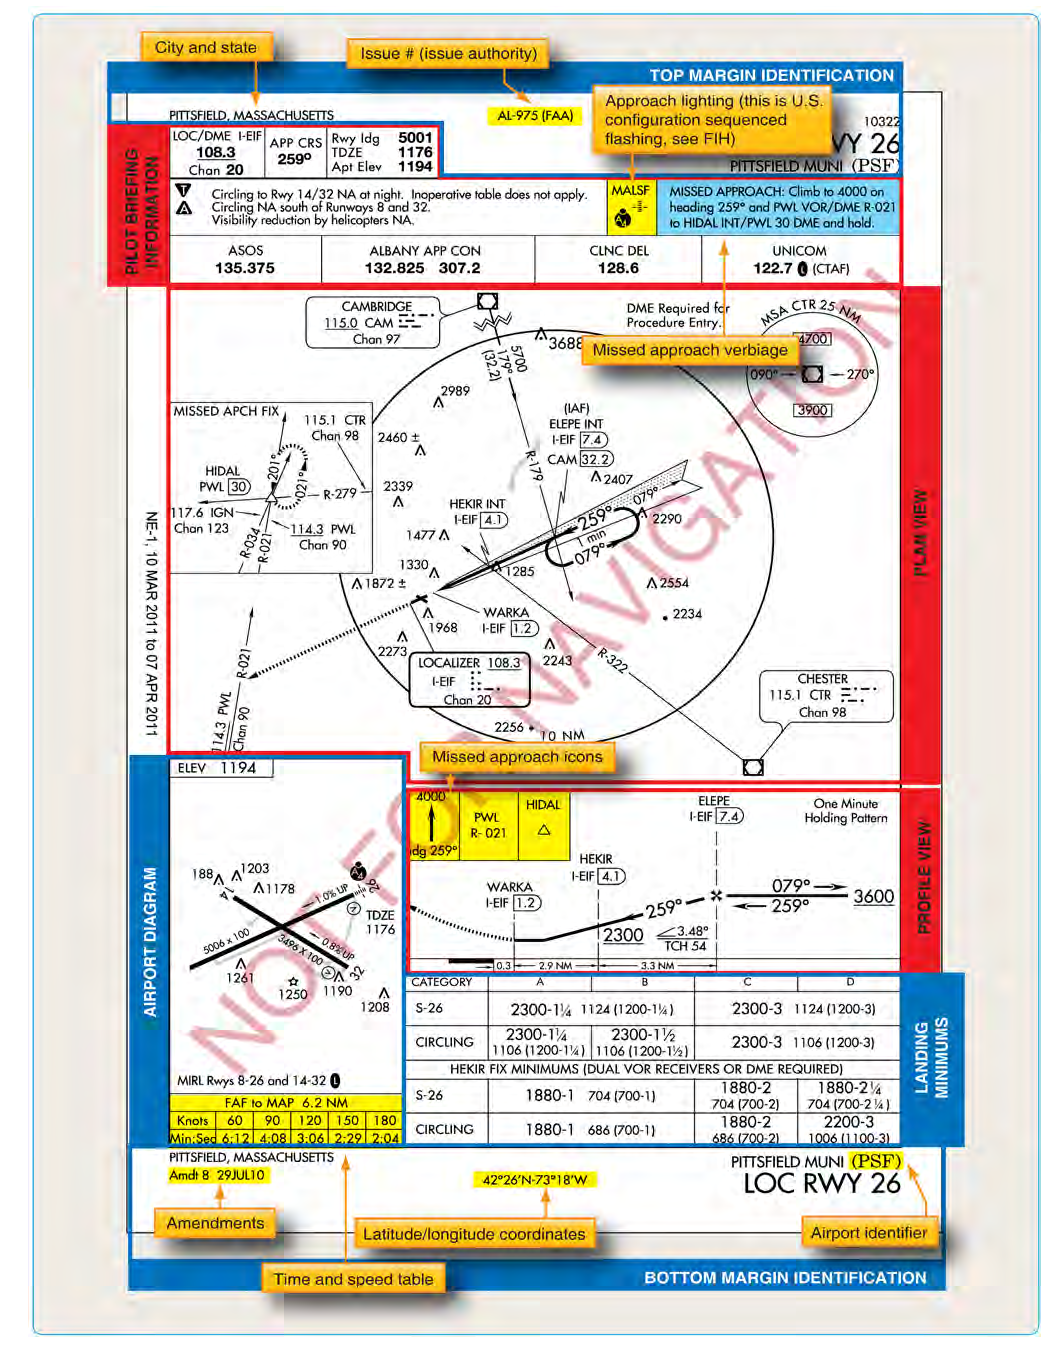
An Instrument Approach Procedure (IAP) chart is the roadmap that guides a pilot from the enroute environment down to the runway — or to an alternate course of action — entirely by reference to cockpit instruments. Issued by the FAA and published by official sources such as the National Aeronautical Charting Office (NACO), these charts follow a rigid, standardized layout so that a pilot transitioning between airports in different states, or flying a different approach type for the first time, can locate critical information instantly. For the instrument rating knowledge test and practical test, fluent IAP chart reading is non-negotiable: every box, icon, and number on the chart has a specific meaning, and examiners expect you to know them cold.
This article systematically walks through each major section of a United States government IAP chart (commonly called a "Jepp-style" when referencing Jeppesen, but the focus here is the FAA/NACO format), explains what each element means, and highlights the practical and regulatory reasons the information matters.
The Five Main Sections of an IAP Chart
The FAA structures every IAP chart into five horizontal bands or sections, arranged from top to bottom: the Heading Section, the Briefing Strip (Notes Section), the Plan View, the Profile View, and the Minimums Section. A sixth area — the Airport Diagram — usually appears in the lower right corner. Each section has a dedicated job, and learning to scan them in order builds a reliable pre-approach briefing habit.
Heading Section
The top strip of the chart carries administrative and identification data. Key items include:
- Procedure name: Identifies the approach type and runway, for example "ILS OR LOC RWY 28L." The name tells you the primary navigation source, any backup capability, and the runway you are aiming for.
- Airport name and city/state: Confirms you have pulled the correct chart for the correct airport — a surprisingly easy error in busy operations.
- Airport identifier and elevation: The four-letter ICAO (or three-letter domestic) identifier, plus the airport's field elevation in feet MSL. Field elevation is critical for computing minimum descent altitudes and for obstacle awareness.
- Procedure amendment date and chart number: The effective date cycle (every 28 days) and revision number. Always confirm currency — flying an expired chart is both illegal under 14 CFR Part 91 and dangerous.
- Frequency data: Final approach course, localizer frequency (for ILS/LOC), and sometimes the Morse code identifier for the navaid. You cross-check the identifier aurally as part of navaid identification.
Briefing Strip (Notes Section)
Immediately below the heading, the briefing strip contains critical operational notes that affect the entire approach. Pilots should read this section first during pre-approach briefing because it can disqualify the approach for certain aircraft or conditions before you even look at the minimums.
- Communication frequencies: ATIS, approach control, tower, ground, and CTAF appear here in the order you will use them. In practice, you dial them in during descent so switching is seamless.
- Transition altitudes and procedure notes: Statements like "DME required," "ADF required," "Simultaneous approaches in use," or "Straight-in not authorized" are printed here. These notes have legal and procedural weight — if your aircraft lacks required equipment and no alternate note applies, you cannot fly that procedure.
- Missed approach instructions (textual): The textual version of the missed approach procedure appears in the briefing strip, in plain language. The profile view shows it graphically, but the text here is the authoritative description. Memorize or brief it before descending below the Final Approach Fix (FAF).
Plan View
The plan view is the top-down depiction of the approach environment, centered on the final approach course. Think of it as a map zoomed in on the terminal area. It extends far enough to show the Initial Approach Fix (IAF) and any transitions, but it is not a substitute for an enroute chart — the scale is specific to the approach environment.
- Navaids and fixes: VORs, NDBs, waypoints (named intersections), and DME fixes are depicted with standard symbology. Filled triangles indicate IAFs; other fixes along the approach path are shown by their respective icons.
- Procedure turn or hold-in-lieu of procedure turn (HILPT): If a course reversal is required, the barbed arrow (procedure turn) or racetrack pattern (HILPT) is drawn in the plan view. The distance limit (e.g., "remain within 10 NM") is annotated nearby.
- Final approach course and magnetic heading: A bold line with the inbound course value — for example 283° for a runway 28L approach — is the centerpiece of the plan view.
- Terrain and obstacle depiction: Maximum elevation figures (MEFs) in quadrants show the highest known obstacle or terrain in that area, rounded up. Shading may indicate rising terrain. This data underpins the designed obstacle clearance built into the minimums.
- Feeder routes and transition routes: Thick lines with altitudes show how to get from the enroute structure to the IAF. Altitudes shown are minimum altitudes for IFR obstacle clearance on that segment.
Profile View
The profile view is the side-on cross-section of the approach from the IAF to the missed approach point (MAP), and it is the most operationally dense section of the chart. This is where descent planning lives.
- Glide slope depiction (precision approaches): On an ILS, the glide slope angle (typically 3.00°) is shown as a descending line. The threshold crossing height (TCH) — how high the glide slope passes over the runway threshold, commonly 50–55 feet — is annotated. The glide slope intercept altitude and the FAF altitude are labeled.
- Step-down fixes (non-precision approaches): For approaches without vertical guidance (LNAV, VOR, NDB), the profile shows a series of step-down fixes where you may descend to progressively lower altitudes after crossing each fix and confirming obstacle clearance. Each fix has a mandatory crossing altitude.
- Final Approach Fix (FAF): Depicted by a Maltese cross (×) symbol on non-precision approaches. This is where timing begins for non-DME non-precision approaches and where the final descent to MDA commences.
- Visual Descent Point (VDP): Shown as a "V" on the profile, the VDP is the point on a non-precision approach from which a normal (approximately 3°) descent from the MDA can be made to land in the touchdown zone. Reaching the MDA before the VDP means you must fly level at MDA until the VDP — descending early risks flying below the MDA without the required visual reference.
- Missed approach point (MAP) and missed approach procedure: The MAP is depicted graphically (often at the runway threshold for precision approaches, or at a specific fix or time for non-precision). The missed approach climbing turn, altitude, and clearance limit are shown graphically here and match the text in the briefing strip.
- Touchdown Zone Elevation (TDZE) and threshold elevation: The TDZE is the highest point in the first 3,000 feet of the runway landing surface. It is used to compute Decision Altitude (DA) for precision approaches and for setting the altimeter to cross-check.
Minimums Section
The minimums section, at the bottom of the chart, is where the regulatory floor of the approach is expressed. It is organized in columns by aircraft approach category (A, B, C, D, E — based on 1.3 times the aircraft's stall speed in the landing configuration, Vso, or Vref if specified) and by approach type (e.g., ILS, LOC, circling).
- Decision Altitude (DA) vs. Minimum Descent Altitude (MDA): Precision approaches (ILS, LPV) use a DA — the altitude at which the pilot must either see the required visual references and continue, or execute the missed approach. Non-precision approaches use an MDA — the pilot levels off and flies at that altitude until the MAP, descending only with required visual references in sight. The DA/MDA is expressed in feet MSL, and the height above touchdown (HAT) is shown in parentheses.
- Visibility requirements: Listed in statute miles (SM) or runway visual range (RVR) in hundreds of feet. RVR is more precise and used at airports with transmissometers. Note that RVR 2400 ≈ ½ SM but they are not legally interchangeable in all situations — the chart specifies which applies.
- Circling minimums: Circling approaches have higher minimums than straight-in because the pilot must maintain obstacle clearance while maneuvering. Circling MDA depends on aircraft category and may be significantly higher than the straight-in MDA.
- Alternate minimums notation: An "A" inside a black triangle in the heading or minimums section signals that non-standard alternate minimums apply — the pilot must consult the separate Alternate Minimums section of the chart booklet before filing that airport as an alternate.
- NA (Not Authorized): If "NA" appears for a category or condition, that approach is not authorized for that aircraft category or when certain conditions (e.g., specific navaid) are unavailable.
Airport Diagram
In the lower right corner, a simplified airport diagram shows runway layout, orientation, displaced thresholds, and sometimes taxiway identifiers. It helps the pilot visualize the landing environment and confirms runway alignment during transition from instruments to visual flight. It is not a substitute for the airport diagram chart used for ground operations.
Why Fluent Chart Reading Matters
A poorly briefed IAP is a leading precursor to controlled flight into terrain (CFIT) and runway incursions. The FAA's Instrument Flying Handbook (FAA-H-8083-15) emphasizes that a complete approach briefing — covering frequencies, courses, altitudes, FAF, minimums, and missed approach — must be completed before beginning the descent. In IMC, there is no time to search the chart for the MDA once you are established on the final approach course.
Key Numbers and Rules
- Aircraft approach categories are based on 1.3 × Vso (stall speed in landing configuration), or Vref where specified: Cat A <91 kt, Cat B 91–120 kt, Cat C 121–140 kt, Cat D 141–165 kt, Cat E 166 kt or more.
- IAP charts are updated on a 28-day cycle; using an expired chart violates 14 CFR Part 91 requirements for current data.
- The FAF on non-precision approaches is marked by a Maltese cross in the profile view.
- The VDP is the latest point from which a normal 3° descent from MDA reaches the touchdown zone — passing it without visual contact means the approach is not recommended to continue.
- Standard ILS glide slope angle is 3.00°; the angle is published on the chart if non-standard.
- Under 14 CFR 91.169, the default IFR alternate minimums (when an airport is not listed in the Alternate Minimums section) are 600-2 for a precision approach and 800-2 for a non-precision approach. The "A" triangle flags that the airport has published nonstandard alternate minimums that must be consulted instead — it does not mean every approach at that airport otherwise defaults to 600-2/800-2, and different rules apply to Part 121/135 operations.
Memory Aid
"ATIS, Approach, Tower, Ground" (AATG) — the order in which communication frequencies appear in the briefing strip mirrors the order you will actually use them on the approach. Dialing them in top-to-bottom during descent keeps you ahead of the aircraft.
A second widely used briefing mnemonic is the "5 T's" at each fix: Turn, Time, Twist, Throttle, Talk. While not printed on the chart, it ensures you execute each step at every approach fix — directly tied to the fixes and altitudes you brief from the profile view.
Common Test Traps
- DA vs. MDA confusion: The FAA frequently tests whether a student knows that DA is used on precision (and LPV) approaches and requires an immediate missed approach if visual references are not acquired — you cannot "duck under" at the DA the way some misunderstand MDA behavior.
- Approach category misidentification: Using the wrong aircraft category column gives incorrect minimums. Remember that category is based on 1.3 × Vso (or Vref), not maximum certificated landing weight or cruise speed, and that Category E exists for the fastest aircraft.
- Ignoring the "A" triangle: Students often miss the alternate minimums triangle and assume standard alternate minimums apply, which can result in an illegal or impractical flight plan.
- Procedure turn when not authorized: The plan view may show "NoPT" on certain routes. Executing a procedure turn on a NoPT routing is a deviation from the clearance and a safety hazard in radar-controlled environments.
- Circling vs. straight-in minimums: The minimums section lists both, and circling minimums are always equal to or higher than straight-in. On the test, be careful to apply the correct row for the question's scenario.